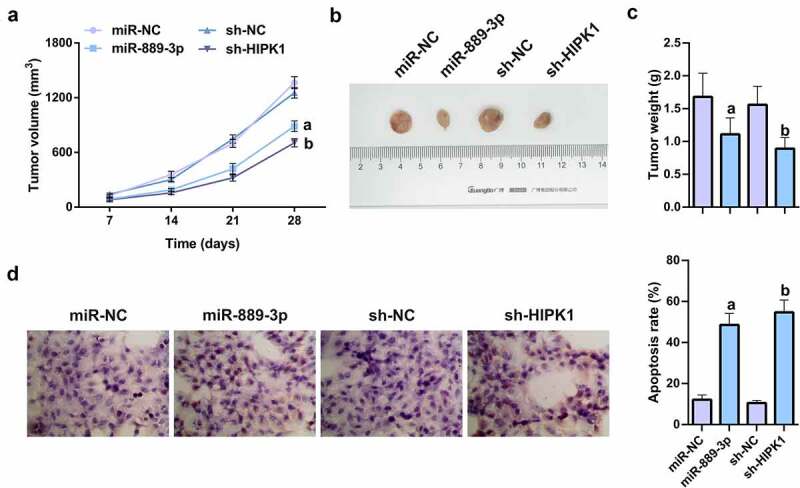
Figure 7.

MiR-889-3p upregulation or HIPK1 knockdown represses tumor growth in vivo.
A. Growth curve images of nude mice after subcutaneous injection of each group of cells; B. Tumor images after 28 days; C. Tumor weight in nude mice 28 days after subcutaneous injection of cells in each group; D. TUNEL staining to detect apoptosis in the tumor tissue of each group. The data in the figures were all measurement data in the form of mean ± SD; a vs the miR-NC, P < 0.05; b vs the sh-NC, P < 0.05.
