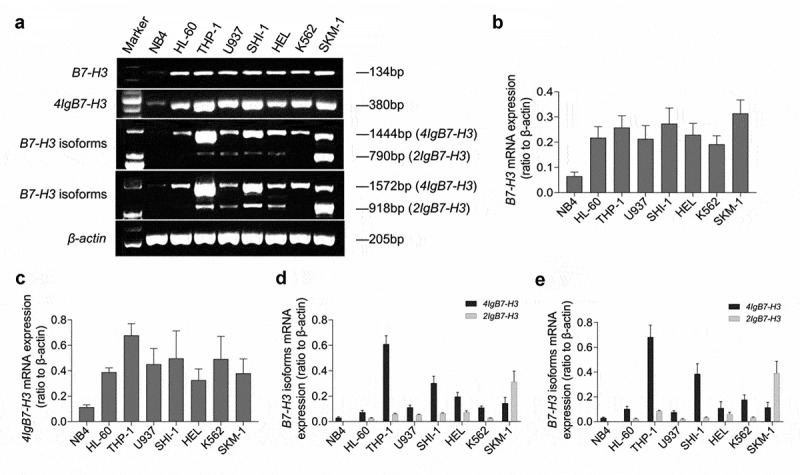
Figure 1.

The mRNA expression of B7-H3 isoforms in 8 AML cell lines. (a-e) RT-PCR was used to analyze mRNA expression with various B7-H3-specific primers. The ordinate in B-E represents gray values of B7-H3, 4Ig B7-H3, B7-H3 isoforms (detected by B7-H3-specific primer 3), and B7-H3 isoforms (detected by B7-H3-specific primer 4)/gray value of β-actin, respectively. The data is gained from no less than 3 individual experiments
