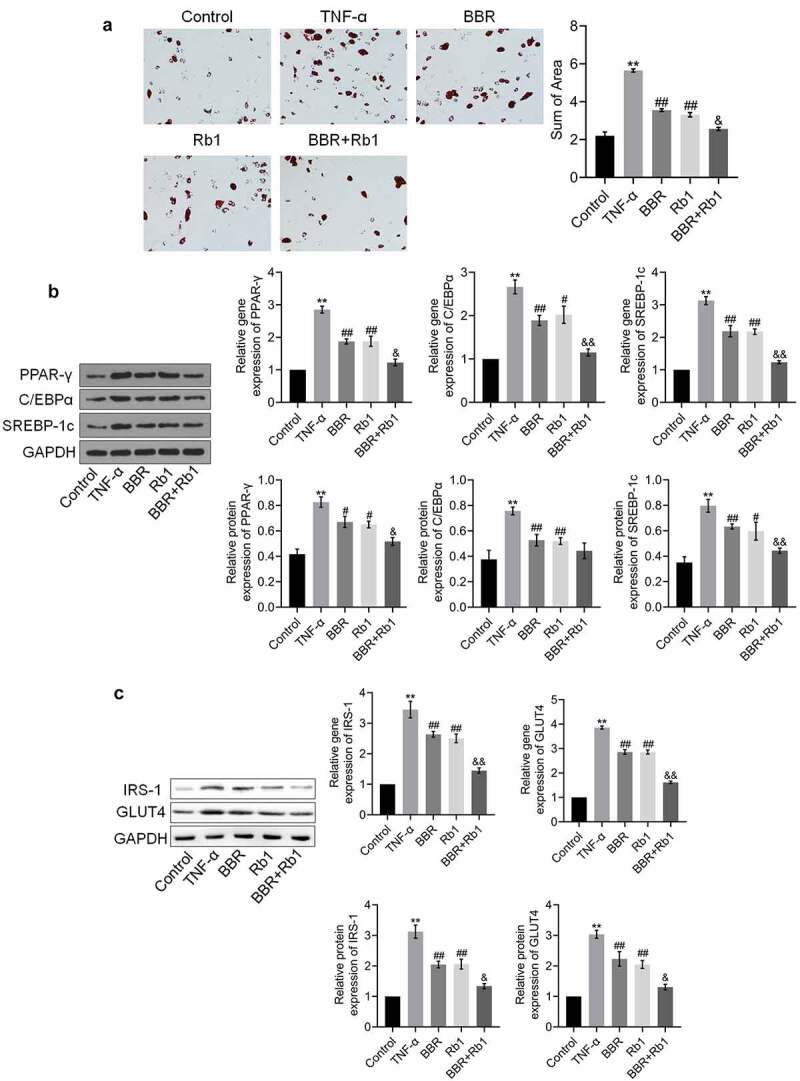
Figure 3.

BBR and Rb1 synergistically suppressed adipogenesis and insulin resistance in TNF-α-treated adipocytes. (a) Adipogenesis was evaluated via oil red O staining assay (**, p < 0.01, compared to Control; ##, p < 0.01, compared to TNF-α; &, p < 0.05, compared to BBR or Rb1). (b) The gene and protein expression levels of PPAR-γ, C/EBPα, and SREBP-1 c were measured by performing RT-PCR and western blot assays, respectively (**, p < 0.01, compared to Control; ##, p < 0.01, compared to TNF-α; &&, p < 0.01, compared to BBR or Rb1). (c) The gene and protein expression levels of IRS-1 and GLUT4 were measured via RT-PCR and western blot assays, respectively (**, p < 0.01, compared to Control; ##, p < 0.01, compared to TNF-α; &, p < 0.05, compared to BBR or Rb1; &&, p < 0.01, compared to BBR or Rb1)
