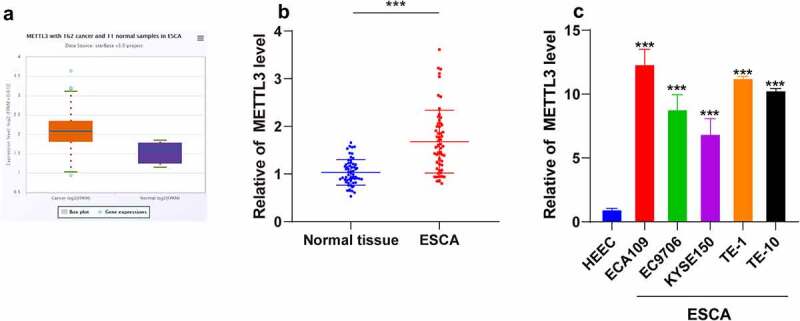
Figure 1.

METTL3 was upregulated in ESCA. ESCA tissues and normal paracancerous tissues were collected. ESCA cell lines (ECA109, EC9706, KYSE150, TE-1, and TE-10) were selected with normal HEECs as the control. A: METTL3 expression pattern in ESCA patients was analyzed through the Starbase website (http://starbase.sysu.edu.cn/); B: METTL3 expression pattern in ESCA tissues and normal paracancerous tissues were detected via qRT-PCR; C: METTL3 expression pattern in different ESCA cell lines and HEECs were detected via qRT-PCR. Cell experiment was conducted 3 times independently. Enumeration data in figure B were analyzed using the t test. Measurement data in figure C were represented as mean ± SD and analyzed using one-way ANOVA, followed by Tukey’s multiple comparison test. *** P < 0.001
