
Figure 1.
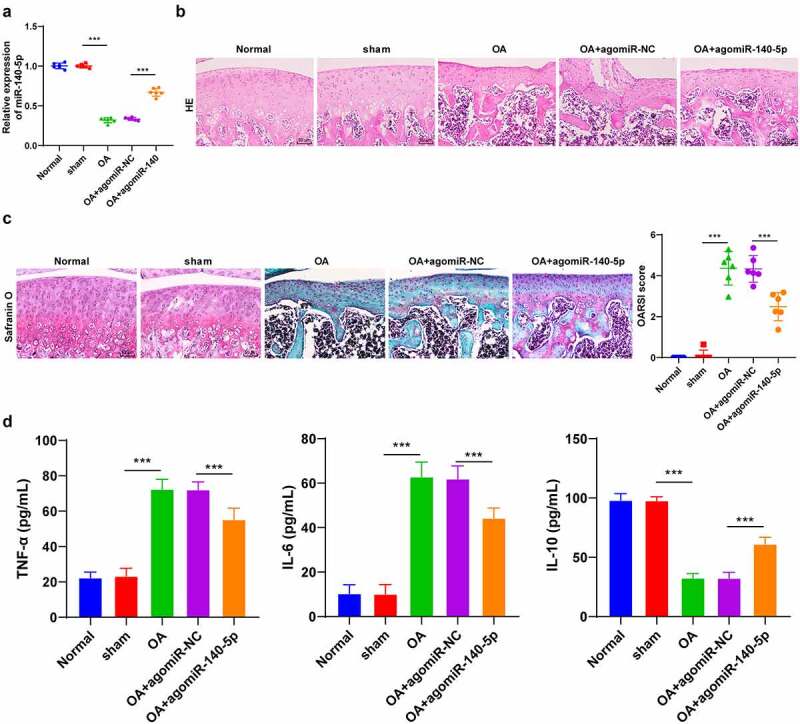
OA induction promoted cartilage tissue degradation. the OA model was established by operation in BALB/c mice. A: miR-140-5p expression was detected using qRT-PCR. B: representative images of hematoxylin and eosin staining. C: safranin O staining. D: inflammatory factors (TNF-α, IL-6, and IL-10) were detected using ELISA kits. N = 6. data in panels A and C are enumeration data; data in panel D is measurement data and expressed as mean ± standard deviation. data were analyzed using one-way ANOVA, followed by Tukey’s multiple comparisons test, ***p < 0.001. OA: Osteoarthritis