
Figure 1.
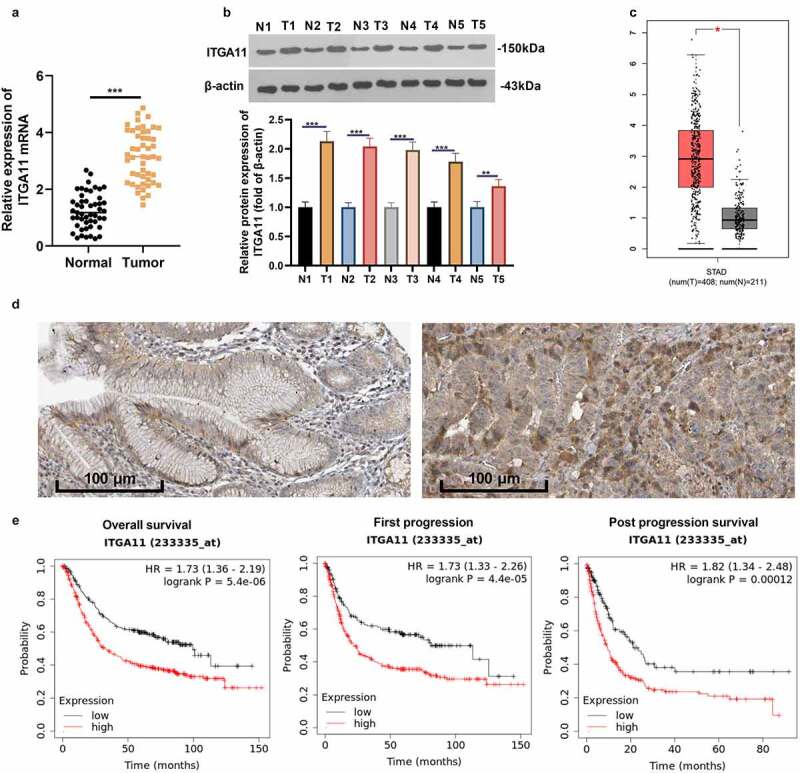
Expression of ITGA11 in GC
A: The ITGA11 profile in cancerous and paracancerous normal tissues of 49 clinical samples was examined by qRT-PCR. B: The ITGA11 profile in five cases of cancerous and paracancerous GC tissues was verified by WB. C: The GEPIA database was adopted to verify ITGA11 expression in GC tissue. D: The effect of ITGA11 on the GC prognosis was analyzed in the human protein altas (https://www.proteinatlas.org/). E. Kaplan-Meier Plotter database (http://kmplot.com/analysis/) was adopted for analyzing the association of ITGA11 levels with overall survival, first progression and post progression survival of GC sufferers. **P < 0.01, ***P < 0.001