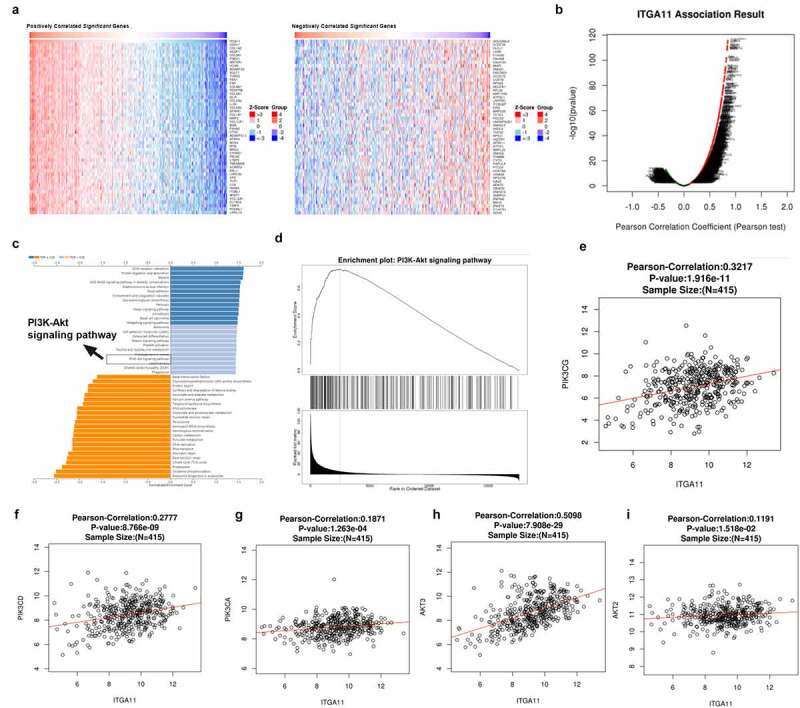
Figure 3.

The regulatory effect of ITGA11 on the ITGA11/ PI3K/AKT pathway
LinkedOmics database (http://linkedomics.org/login.php) was used for analyzing the potential downstream targets of ITGA11. A: The positively and negatively co-expressed Top-50 genes of ITGA11 in GC were displayed in heat maps. B: The overall closely co-expressed genes of ITGA11 in GC were exhibited as a volcano plot. C-D: PI3K-AKT pathway has a potential role in ITGA11 in GC. The data was analyzed by GSEA. E-I: The LinkedOmics database analyzed the correlation between ITGA11 and PIK3CG, PIK3CD, PIK3CA, AKT2, and AKT3
