
Figure 5.
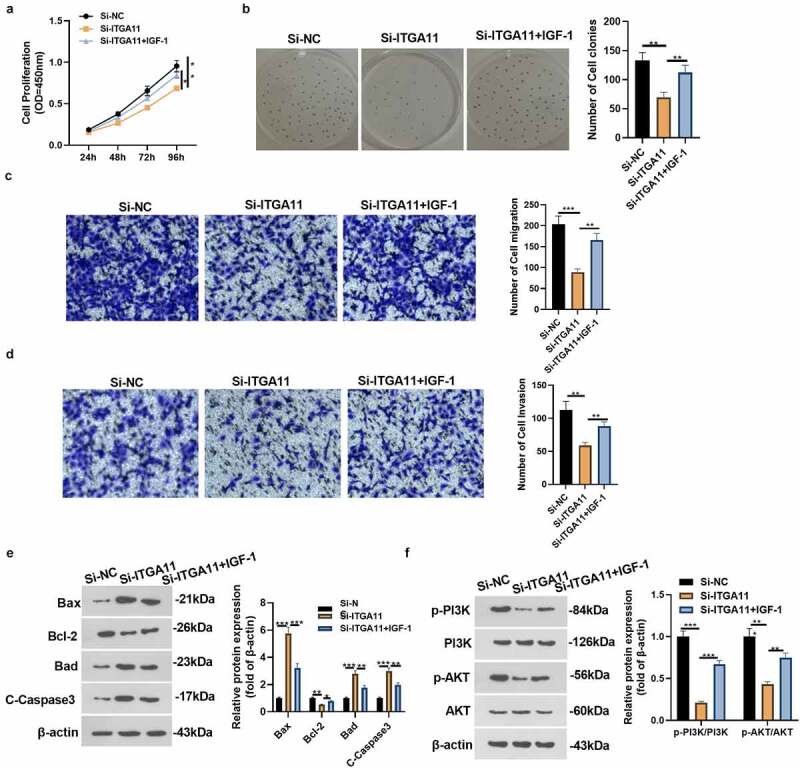
Activating PI3K repressed the effect of ITGA11 knockdown on GC progression
ITGA11 knockdown plasmids and/or IGF-1 were added to MKN45 cells. A-B: The CCK-8 assay and colony formation test were carried out to gauge cell proliferation. C-D: Cell migration and invasion were assessed by Transwell assay. E: The profiles of Bcl-2 and Bax were monitored by WB. F: WB gauged the protein levels of the PI3K/AKT axis in MKN45 cells. * P < 0.05, * * P < 0.01, * * * P < 0.001, N = 3