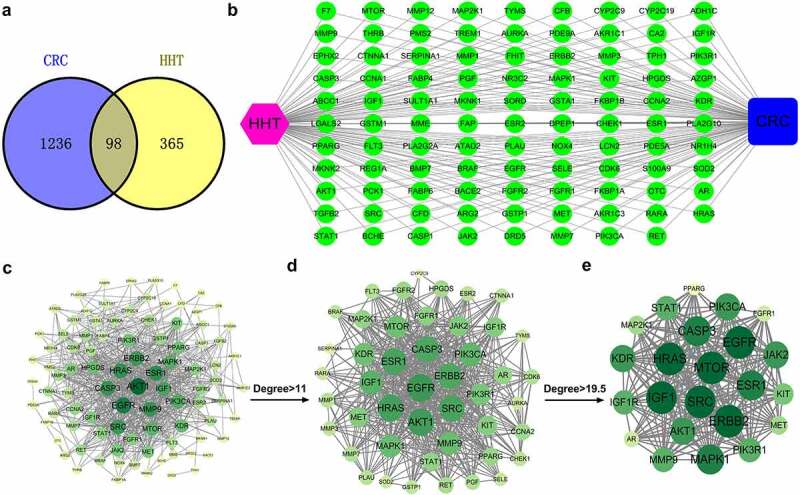
Figure 1.

Network pharmacology construction of HHT against CRC. (a) Venn diagram displays the intersection genes of CRC- and HHT-related targets. (b) ‘Compound-Target-Disease’ network consisting of 100 nodes and 196 edges. (c–e) PPI network of common targets and topological analysis
