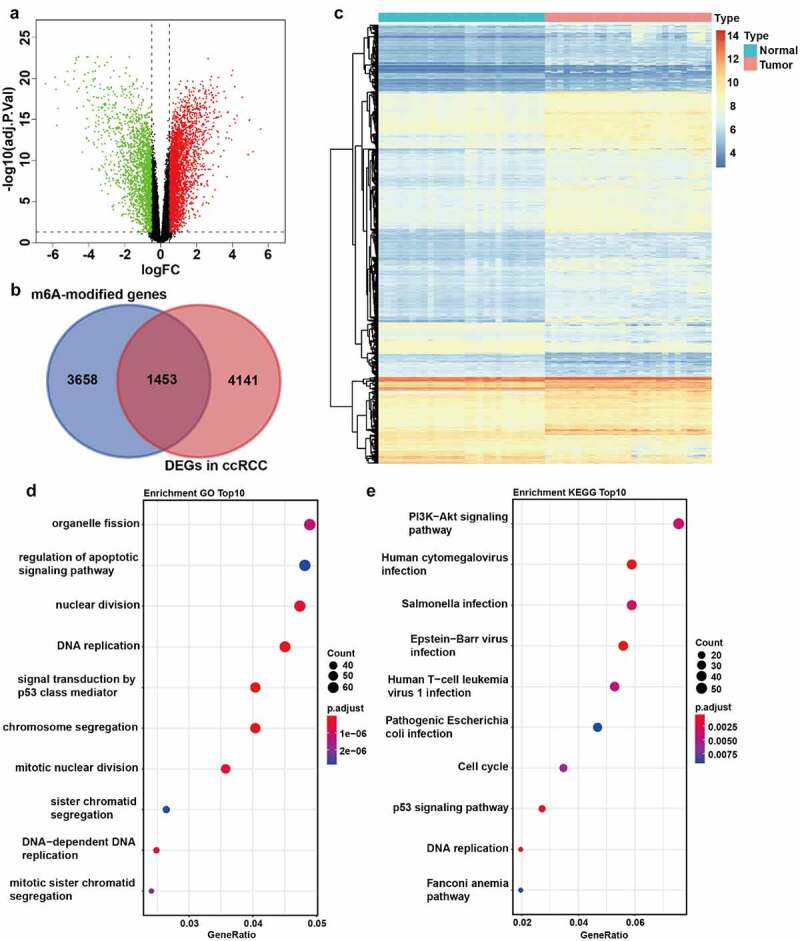
Figure 1.

Identification of m6A-modified DEGs between ccRCC tissues and normal tissues. A The volcano plot visualizes the DEGs in GSE66272. Green dots represent downregulated genes and red dots represent upregulated genes. FC, Fold Change. Adj.P.Val, adjust P value. B The Venn plot of m6A-modified DEGs in ccRCC. C The mRNA levels of m6A-modified DEGs in both ccRCC tissues and adjacent normal tissues from GSE66272. D-E GO (d) and KEGG (e) pathway analysis of m6A-modified DEGs in ccRCC
