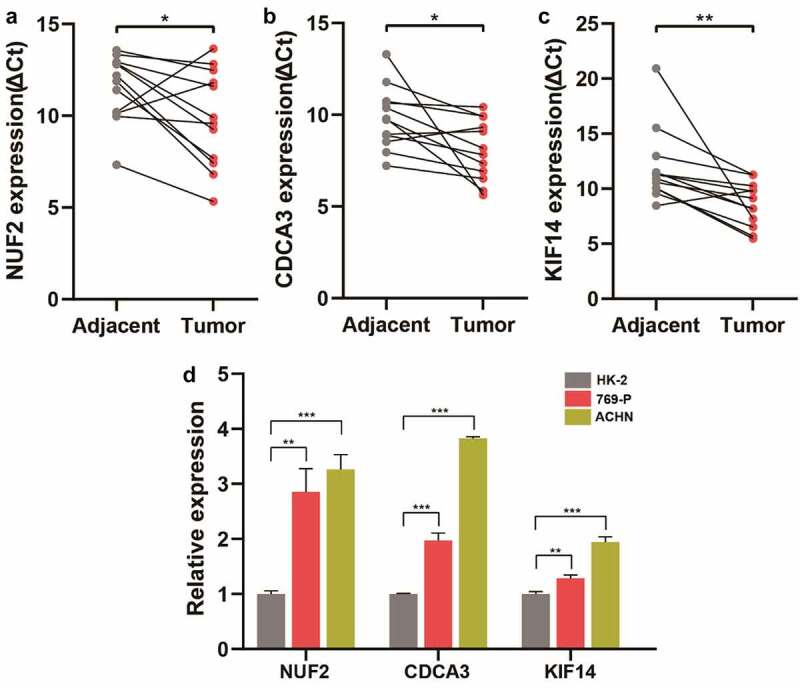
Figure 6.

Validation of NUF2, CDCA3, and KIF14 in ccRCC tissues and cell lines. A-C Detection of NUF2 (a), CDCA3 (b), and KIF14 (c) expression levels in 12 paired ccRCC and normal kidney tissues by qPCR. The expression levels of these three genes were normalized to the reference gene GAPDH. ΔCt, delta threshold cycle. D Detection of NUF2, CDCA3, and KIF14 expression levels in kidney cell lines by qPCR
