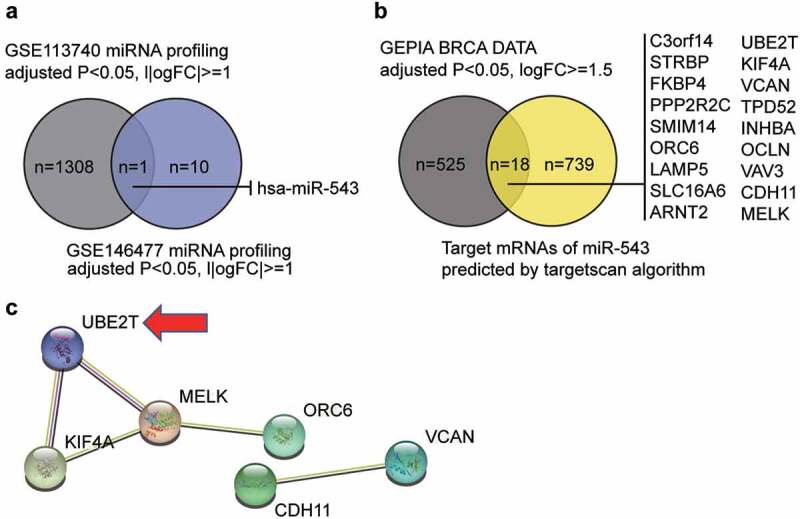
Figure 1.

miR-543 and UBE2T can be key players in breast cancer. (a) The Venn diagram showing the intersection between the GSE113740 miRNA profiling and the GSE146477 miRNA profiling. FC: fold-change. (b) The Venn diagram showing the intersection between the GEPIA breast cancer data and the predicted target mRNAs of miR-543 by targetscan algorithm. FC: fold-change. (c) The PPI analysis of the mRNAs in Figure B using STRING algorithm. Line color indicates the type of interaction evidence
