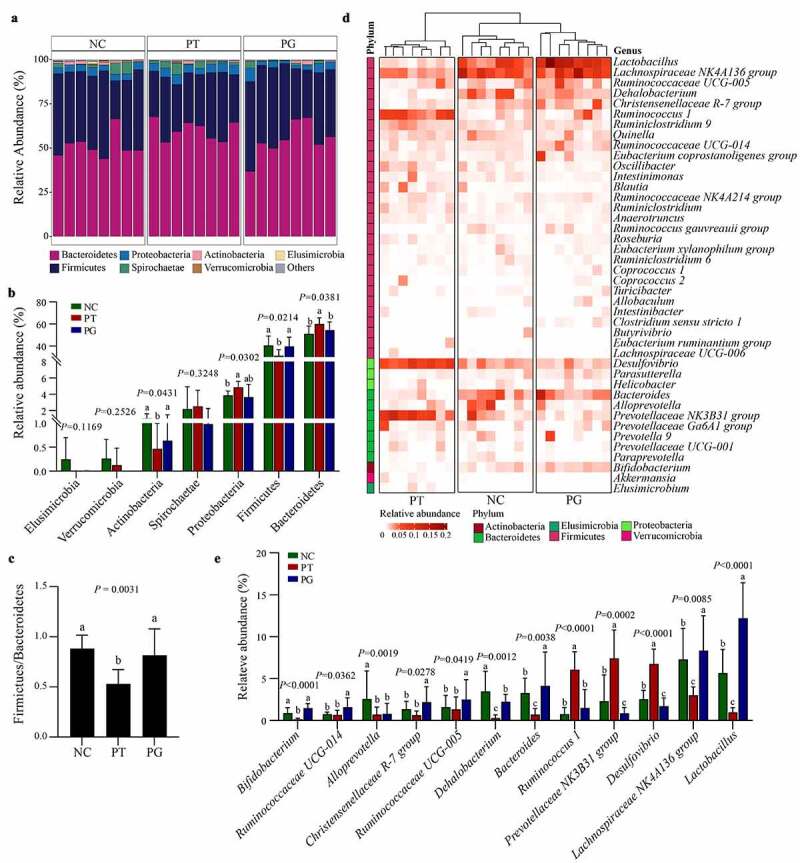
Figure 5.

Gastrodin remodeled the composition of gut microbiota. (a) Stacked bar plot of the gut microbiota at the phylum level. (b) Changes in the abundance of specific microbes at the phylum level. (c) The ratio of Firmicutes to Bacteroidetes (F/B). (d) Heatmap of most abundant genus (relative abundance ≥ 0.01), color coded by phylum following the legend in panel. (e) Changes in the abundance of specific microbes at the genus level. Values are represented as mean ± standard deviation (M± SD). Different superscript letters within a column showed significant difference (P < 0.05)
