
Figure 1.
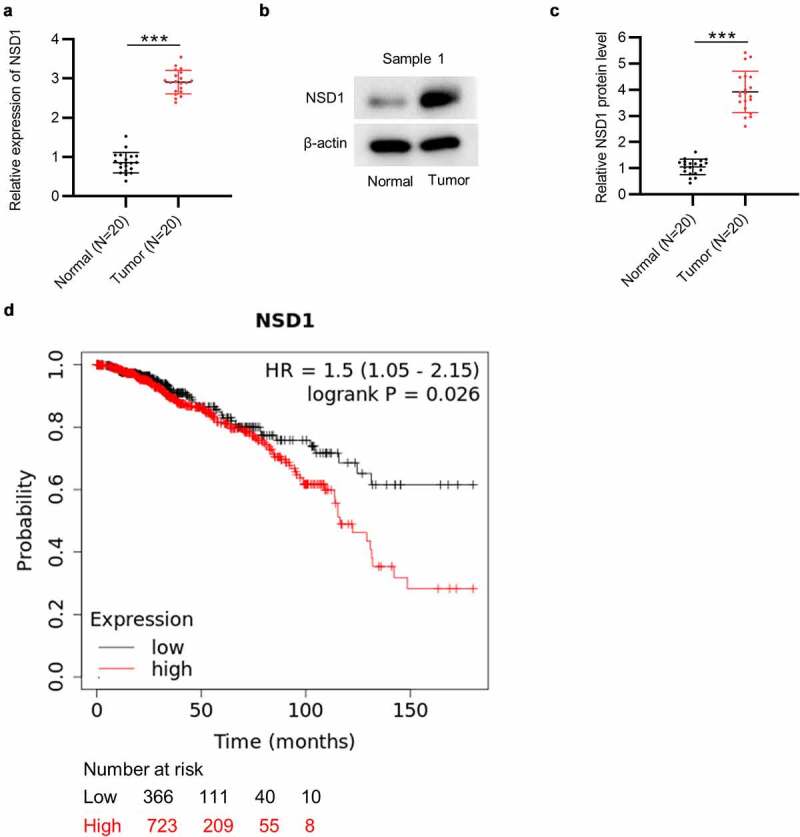
NSD1 displays high level in BC and is related to poor prognosis. (a) RT-qPCR of NSD1 expression in 20 pairs of BC tissues and normal tissues. (b-c) Western blotting of the protein expression of NSD1 in 20 pairs of BC and normal tissues. Protein bands of the other 19 samples are provided in the supplementary file named Figure S1. (d) Kaplan-Meier Plotter analysis of the relationship between NSD1 level and BC patient prognosis. ***p < 0.001