Figure 1.

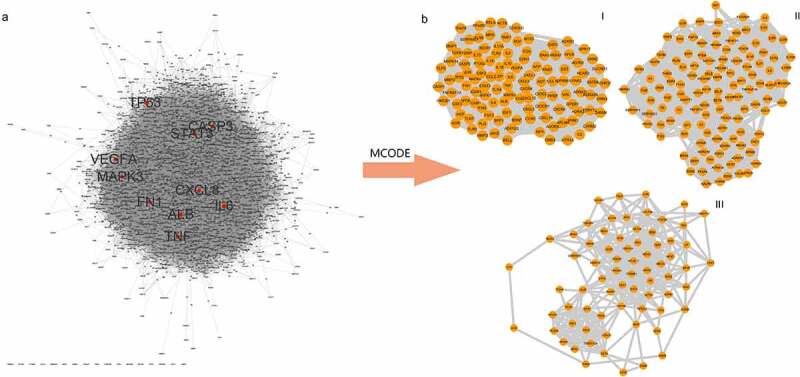
PPI network and Analysis of disease target clusters. (a) PPI network of stroke targets. The middle red nodes represent the top 10 genes with the highest degree values. (b) The three major clusters from the PPI network for stroke targets

PPI network and Analysis of disease target clusters. (a) PPI network of stroke targets. The middle red nodes represent the top 10 genes with the highest degree values. (b) The three major clusters from the PPI network for stroke targets