Abstract
Dengue is a mosquito-borne disease which has continued to be a public health issue in Malaysia. This paper investigates the impact of singular use of vaccination and its combined effort with treatment and adulticide controls on the population dynamics of dengue in Johor, Malaysia. In a first step, a compartmental model capturing vaccination compartment with mass random vaccination distribution process is appropriately formulated. The model with or without imperfect vaccination exhibits backward bifurcation phenomenon. Using the available data and facts from the 2012 dengue outbreak in Johor, basic reproduction number for the outbreak is estimated. Sensitivity analysis is performed to investigate how the model parameters influence dengue disease transmission and spread in a population. In a second step, a new deterministic model incorporating vaccination as a control parameter of distinct constant rates with the efforts of treatment and adulticide controls is developed. Numerical simulations are carried out to evaluate the impact of the three control measures by implementing several control strategies. It is observed that the transmission of dengue can be curtailed using any of the control strategies analysed in this work. Efficiency analysis further reveals that a strategy that combines vaccination, treatment and adulticide controls is most efficient for dengue prevention and control in Johor, Malaysia.
Keywords: Bifurcation, Dengue disease transmission, Efficiency analysis, Stability analysis, Vaccination
Introduction
Dengue Fever (DF) is the most rapidly emerging mosquito-borne viral infection worldwide [1, 2]. The disease is a major public health concern throughout tropical and sub-tropical regions of the world [1, 3, 4], in more than 100 countries in South-East Asia, the Western Pacific and South and Central America [1]. Nowadays, dengue is endemic in most tropical and sub-tropical areas of the globe [3], and its transmission has increased predominantly in urban and semi-urban areas recently [2]. Up to 2.5 billion people worldwide live under the threat of DF and its severe forms–Dengue Haemorrhagic Fever (DHF) or Dengue Shock Syndrome (DSS) [1]. The World Health Organisation (WHO) estimated that, annually, 9 million symptomatic cases and 0.5 million severe episodes of dengue occur globally [3].
Moreover, while dengue is a worldwide health issue, with a consistent increment in the number of nations announcing the disease, presently near 75% of the worldwide population at dengue risk are in Asia-Pacific region [2]. Since the 1950s, dengue has become a serious health issue in South-East Asia region [5]. In recent decades, DHF has become a significant reason for hospitalisations and deaths among children in the greater part of the Asian countries [6], including Malaysia. In Malaysia, dissemination of dengue cases vary considerably among states and districts where dengue cases are more pronounced in urban and suburban areas [7, 8]. The first dengue outbreak in Malaysia occurred in 1902. Since then, the nation has progressively well-known for ceaseless dengue endemic cases as a result of the continual increase in reported cases of DF [5].
DF is transmitted by dengue viruses that are members of the genus Flavivirus and family Flaviviridae [1]. There are four immunologically distinct but antigenically similar dengue virus (DENV) serotypes, namely DENV-1, DENV-2, DENV-3 and DENV-4, causing dengue disease [3, 4, 9]. The viruses are transmitted to humans by the bites of infected female mosquitoes of the genus Aedes [3, 4]. Aedes aegypti mosquito is the primary vector of dengue [4]. Dengue infection can cause a spectrum of clinical outcomes ranging from completely asymptomatic, undifferentiated viral syndrome, DF, DHF to DSS [3, 10]. A person can be infected with dengue virus up to four distinct times with an infection connecting to a particular virus serotype. An individual that gets infected by any of the four virus serotypes develops lifelong immunity to it, but just an impermanent cross-insusceptibility to the other virus serotypes [3, 8].
There is no particular treatment for dengue disease [11]. Clinical management depends on supportive therapy, mainly cautious monitoring of intravascular volume replacement [11]. Lately, dengue vaccine development has dramatically accelerated as a result of the increase in the number of dengue infections, just as the prevalence of everyone of the circulating DENV-1,2,3,4 serotypes [12]. The recently licensed dengue vaccine, Dengvaxia (CYD-TDV) made by Sanofi Pasteur has been approved by regulatory authorities in more than twenty countries [11], including Indonesia and Mexico [13]. The vaccine protects against DENV-1, DENV-3 and DENV-4 but only imperfectly against DENV-2 [13]. Thus, it may or may not be possible to have any future perfect dengue vaccine that protect against the four virus serotypes [14].
Until Dengvaxia vaccine was licensed, dengue prevention and control rely on interventions targeting the vector, for which WHO recommends integrated vector management [11]. Some basic control strategies intend to keep mosquitoes from getting to egg-laying habitats, using ecological management interventions such as removal of artificial man-made habitats for mosquitoes, application of suitable insecticides or predators to outdoor water storage containers, use of personal and household protection (like window screens, long-sleeved clothe, insecticide or mosquito repellents, vaporizers and coils) and open space spray of insecticide during dengue outbreak [11].
Mathematical models describing the dynamics of interactions between host and vector go back to Lotka [15] and Ross [16], first used to study vector-host dynamics in the context of Malaria. Variations of such framework have been applied to dengue [8, 14, 17–25]. In many previous studies, several authors have used compartmental deterministic models to investigate the transmission dynamics of dengue disease in general [17–21]. Similarly, many previous authors have used compartmental deterministic models to examine the dynamics of dengue disease spread in specific regions or countries [14, 22–24].
In particular, mathematical study of the epidemiology of dengue disease in Malaysia has been studied by many previous researchers. For instance, Side and Noorani [26] used a mathematical model based on SEIR (Susceptible-Exposed-Infectious-Recovered) structure to analyse dengue disease spread in Selangor state of Malaysia. Later, the work of Side and Noorani [26] was revisited by Side and Noorani [27] to propose a new compartmental model which excludes intrinsic and extrinsic incubation periods in human and mosquito, respectively. The model was simulated for the 2008 dengue outbreaks in Selangor, Malaysia and South Sulewesi, Indonesia. Recently, Hamdan and Kilicman [8] developed a mathematical model involving fractional order differential equations to investigate the dynamical behaviour of dengue disease transmission in Selangor, Malaysia. The model was analysed to derive the basic reproduction number () for it, which was used to carry out sensitivity analysis of the model parameters and discuss the global stability of the equilibrium points. Liang et al. [25] constructed a compartmental mathematical model based on the classical SIR model structure to investigate the impact of auto-dissemination trap on dengue disease transmission using Shah Alam city in Selangor state of Malaysia as a case study.
Until now, there is no licensed vaccine for dengue in Malaysia. Dengue prevention and control primarily depends on vector control or host-vector contacts interruption [8, 28]. In Malaysia, vector control is mainly based on passive case surveillance which relies on healthcare professionals to notify public health authorities of all suspected or laboratory-confirmed dengue cases [29]. Then, open space spray of insecticides is administered to kill adult Aedes mosquitoes in the dengue hotspot zone to accomplish quick control of the new outbreak [28]. However, this responsive method of surveillance with the health specialists holding up until the medical community recognises dengue cases before responding to actualize control measures is very unresponsive owing to the fact that doctors have low index for diagnosing dengue during inter-epidemic periods [10]. In most cases, dengue outbreaks are possibly recognised when the transmission is at its peak during which it is past the point where the implementation of effective preventive measures that halt the disease spread is possible [30]. Another significant thought is that the use of surveillance alone likewise disregards the patients who present with undifferentiated febrile illness or viral syndrome. This group of patients speaks to a huge extent of those with symptomatic dengue disease, contingent upon the age of the patient and the strain of infecting virus [10]. Also, vector control has been shown to be only partially effective in reducing disease burden [31]. At last, the prevention of dengue in Malaysia may rely upon the accessibility of an effective vaccine in the country. Hence, there is the need for a reliable deterministic model to better understand the mechanism of dengue disease spread and control by incorporating vaccination into the present day control strategies for dengue in Malaysia.
In this paper, our interest is to develop a compartmental deterministic model that creates a framework for integrated vector management in order to examine the impact of separate use of vaccine and efforts of combining vaccine with treatment and insecticide controls on the dynamics of dengue disease spread in Malaysia. The model is parameterized using data from the 2012 dengue outbreak in Johor, Malaysia.
The remainder of this paper is organised as follows: Second section presents the development of a mathematical model describing the dynamical behaviour of dengue disease transmission between the interacting host and vector populations with effect of random mass vaccination. In third section, theoretical analysis of the model is carried out. Fourth section discusses the parameter estimation and model fitting. Sensitivity analysis of the model parameters is discussed in fifth section. This is followed up by the formulation of a new model incorporating triplet controls that are vaccination, treatment and adulticide control measures in sixth section. Qualitative analysis of the basic properties of the model is also discussed. Numerical simulation of the models and discussion of results are presented in seventh section. Conclusion is finally drawn in last section.
Model Formulation
In this section, we formulate a mathematical dengue model including vaccination compartment with consideration of the pre-intervention model presented in a previous work [21].
Model Assumptions
Depending on the epidemiological status of individuals, the total human population is divided into susceptible (), vaccinated (), exposed (), infectious () and recovered individuals (). In a similar manner, the aquatic mosquitoes are described by a compartmental class , the total population of female mosquitoes is grouped into susceptible (), exposed () and infectious () mosquitoes. It is assumed that there is no human and mosquito migration, so the population is constant. It is assumed that standard (or proportional) incidence is appropriate for a large population (state). Human and mosquito populations are homogeneously mixing, implying that every mosquito has equal probability of biting any host. The virus can only be transmitted by infectious humans () and mosquitoes (). Only one strain of dengue virus is present in the population, and responsible for all the dengue infections. Primary infections are generally asymptomatic and non-fatal [32], thus it is assumed that there is no dengue-related deaths. Also, it is assumed that an imperfect vaccine with up to 90% efficacy is administered in the human population with random mass vaccination scenario. There is no consideration for vertical transmission in both human and mosquito populations. Mosquitoes lack an adaptive immune response, hence they cannot form resistance to a pathogen.
The Model and Its Parameters
The total human population at any time t, denoted as , is assumed to be constant, and is given as
| 1 |
Similarly, the size of total female mosquito at any time t is assumed to be constant and given as
| 2 |
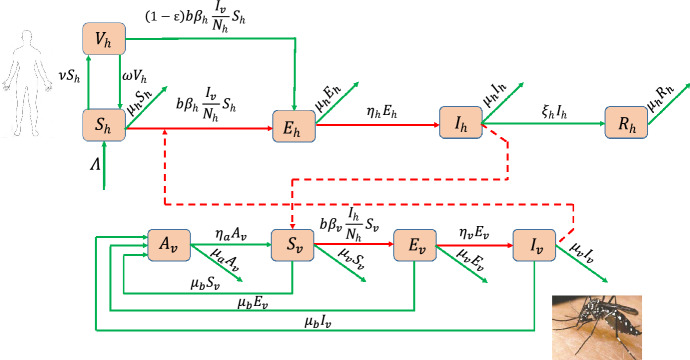
Let be the constant recruitment rate of human population, which enters the susceptible population. Individuals in the vaccinated class with waning immunity join class at rate . This population is decreased either by natural death at rate , or following the infection through an effective contact with an infected mosquito at the rate given as
| 3 |
where b is the biting rate per , is the transmission probability of dengue virus from to . Class is further decreased by vaccination at constant rate .
The vaccinated class is populated by the fraction . Since it is assumed that the dengue vaccine is not 100% efficacious but highly effective, then the vaccinated class decreases by infection at the rate for , where is the vaccine efficacy. For instance, measures zero efficacy of the vaccine, while the vaccine is 100% efficacious at . The class is further decreased either by the fraction whose vaccine has waned out, where is the vaccine waning rate, or by natural death at rate .
When individuals in both classes and are infected, they progress to the exposed class . Class is reduced either when individuals in the class developed clinical symptoms of dengue and move to class at rate or individuals die naturally at rate .
Individuals in class may recover at the rate or die at natural death rate . The population of recovered individuals is reduced by natural death at rate .
The aquatic mosquito population is generated via the logistic oviposition function assumed to be proportional to the total number of female mosquitoes, so that the aquatic mosquito is recruited at rate , where K is the larvae carrying capacity and is the mosquito oviposition rate. The population is reduced either by the progression of larva to female mosquito at rate or natural mortality of larva at rate .
The class is populated by the larvae mosquitoes emerging as female mosquitoes at rate . The population of susceptible mosquito is decreased either following an infection as a result of the effective contact between and at rate
| 4 |
where, b is the biting rate per susceptible mosquito and is the transmission probability of dengue infection from to , or as a result of natural death of the susceptible mosquitoes at rate .
The population of mosquitoes in class is increased by the contact rate between ans . It is decreased either as a result of exposed mosquitoes being moved to the infectious class at rate or they die naturally at rate .
Infectious mosquitoes do not recover, and they may die naturally at rate .
In Eqs. (3) and (4) respectively, and are the forces of infection in humans and mosquitoes. The expression for can be interpreted as follows: the probability that a mosquito chooses a specific human to bite is assumed to be so that a human receives, on average, bites per unit of times such that the infection rate per is given by . In a similar manner, the expression for can be interpreted as well.
Thus, the vaccinated dengue model consisting of nine time-dependent ordinary differential equations (ODEs) given by Eq. (5) as
| 5a |
| 5b |
| 5c |
| 5d |
| 5e |
| 5f |
| 5g |
| 5h |
| 5i |
along with the initial conditions (ICs):
| 6 |
Tables 1 and 2 give the description of the state variables and parameters of model (5) respectively. The scheme of model (5) describing the vector-host interactions for dengue is presented by Fig. 1.
Table 1.
Description of the variables of model (5)
| Variable | Description |
|---|---|
| Susceptible individuals | |
| Vaccinated individuals | |
| Exposed individuals | |
| Infectious individuals | |
| Recovered individuals | |
| Aquatic mosquitoes | |
| Susceptible mosquitoes | |
| Exposed mosquitoes | |
| Infectious mosquitoes |
Table 2.
Description of the parameters of model (5)
| Parameter | Description |
|---|---|
| Recruitment rate of humans | |
| Humans natural mortality rate | |
| Transmission probability per contact of with | |
| Rate of vaccination | |
| Waning rate of vaccine | |
| Efficacy of vaccine | |
| Infectiousness rate of individuals | |
| Recovery rate of individuals | |
| b | Biting rate of mosquitoes |
| Per capita oviposition rate of mosquitoes | |
| K | Carrying capacity of larvae |
| Natural mortality rate of female mosquitoes | |
| Natural mortality rate of aquatic mosquitoes | |
| Maturation rate of aquatic mosquitoes | |
| Transmission probability per contact of with | |
| Rate of infectiousness of mosquitoes |
Fig. 1.
Scheme of the SVEIR + ASEI dengue model (5)
Qualitative Analysis of the Model
Qualitative Properties of Solutions
Positivity of Solutions
This subsection establishes that the solution of each of the state variables of model (5) with non-negative initial data remains non-negative for all time t for the model to be biologically meaningful since it describes the human and mosquito population dynamical behaviours.
Lemma 3.1
Suppose that . Suppose further that the initial data given in (6) are non-negative. Then, the solutions X(t) of the vaccination dengue model (5) remain non-negative for all . Furthermore,
where, and are as expressed by Eqs. (1) and (2), respectively.
Proof
Let . Thus . Equation (5a) gives rise to
| 7 |
Equation (7) implies that
| 8 |
Integrating Eq. (8) over time interval yields
Consequently,
| 9 |
It can be shown by the similar approach that , , , , , , and .
For the second part of the proof, the time derivative of the total human population at time t, in Eq. (1), along the solutions of the dengue model (5) for humans is expressed as
so that
Similarly, the time derivative of the total mosquito population at any time t, defined in Eq. (2), along the solutions of the dengue model (5) for mosquitoes is given as
so that
as required.
Invariant Region
Analysis of the dengue model (5) is carried out in a biologically feasible region given by the set
| 10 |
with
The positivity of region is claimed in the following result.
Lemma 3.2
The region in Eq. (10) is positively invariant relative to the dengue model (5) with positive initial conditions in .
Proof
We follow the idea in Abidemi et al. [24] and Ndii et al. [33] to verify that the feasible region is positively invariant. Model (5) is expressed as
| 11 |
where,
with , , , , , and .
It is clear that all the off-diagonal entries of M(X) are non-negative. Therefore, it is a Metzler matrix. Based on the fact that , then system (11) is positively invariant in , which implies that any trajectory of the system (11) starting from an initial state in the positive orthant remains in forever. Therefore, all feasible solutions of the dengue model (5) enter the region given in Eq. (10).
Qualitative Analysis of the Basic Properties
Existence of Disease-Free Equilibria
In this section, the steady state solutions (equilibrium points) of the dengue model (5) when there are no variations in the state variables , , , , , , , , , and in respect of time t are discussed.
Let and denote the human and mosquito forces of infection at the steady state, respectively, and be given by
| 12a |
| 12b |
Then, setting the right-hand sides of the equations in model (5) to zero, the solutions of the state variables at a steady state (, , , , , , , , ) in terms of the associated form of force of infection are obtained as follows. Solving Eqs. (5a)–(5e) yields
| 13a |
| 13b |
| 13c |
| 13d |
| 13e |
Next, we solve for , and in system (5). It follows from (5g)–(5i) that
| 14a |
| 14b |
| 14c |
Using the results in (14), we have
| 15 |
Thus, plugging the result in (15) into (5f) and simplifying lead to
| 16 |
In (16), has a trivial solution
Putting in Eq. (14) yields
Furthermore, we also have when . Thus, the solutions in (13) reduce to
Hence, dengue model (5) has a trivial equilibrium (TE), denoted as , obtained as
| 17 |
Next, we consider a non-trivial solution of () in (16). Then, the possible solution of can be obtained from
| 18 |
Resolving (18) for , we have
So,
| 19 |
where .
To derive the equilibrium without dengue disease in the system, we set or . Hence, we have from (19) that
| 20 |
Consequently, the threshold regulates the existence of mosquito. So, if , then in (19). It follows that dengue model (5) corresponds to free-mosquito human population and the equilibrium in this scenario is the TE given in (17).
If, on the other hand, , then the non-trivial biologically realistic disease-free equilibrium (BRDFE), denoted as , is obtained from (13), (14) and (20) with as
| 21 |
We then claim the following result.
Theorem 3.1
Let be as defined by (10) and , where is the net reproduction number. Then, the dengue model (5) admits at most two disease-free equilibrium (DFE) points:
-
(i)If , then there exists a DFE, called TE given as
-
(ii)If , then there is a BRDFE defined as
Reproduction Number
It is necessary to derive the effective (or control) reproduction number, denoted as , for the dengue model (5). According to Hethcote [34], “the basic reproduction number is defined as the average number of secondary infections that occur when one infective is introduced into a completely susceptible host population”. The threshold gives an invasion criterion for the initial virus spread in a susceptible population. For this reason, for model (5) is computed using the BRDFE (which describes the coexistence of both the human and mosquito without dengue infections in the interacting populations). The result is presented in Theorem 3.2.
Theorem 3.2
If , then the effective reproduction number related to the dengue model (5) is expressed as
| 22 |
where, .
Proof
We adopt the notation of next generation matrix (NGM) method in [35, 36] to prove Theorem 3.2. Now, note from model (5) that
| 23 |
Then, the infection matrix F and transition matrix V, respectively, are obtained from Eq. (23) as
Thus,
According to [35], , where is the spectra radius (maximum eigenvalue) of matrix A. Therefore, is computed as
The expression in (22) is the number of secondary infections in completely susceptible population due to infections from one introduced infectious individual with dengue.
Existence of Endemic Equilibrium
This section explores the existence of endemic equilibrium (EE) of model (5). In this case, the components of infected variables are non-zero, and consequently and in (12). Then, we assume that . Let the EE of the system (5) be represented by
| 24 |
At equilibrium, it follows from Eq. (5f) that
| 25 |
Similarly, summing up the terms in Eqs. (5g) to (5i) at equilibrium gives
| 26 |
Equating Eqs. (25) and (26), and simplifying yields like before:
| 27 |
Thus, the components of EE () in (24) are defined by
| 28 |
Next, the appropriate solutions from Eq. (28) are plugged into and in Eq. (12). After rigorous calculation, the endemic equilibria of the dengue model (5) satisfies the polynomial obtained as
| 29 |
where,
Therefore, the positive EE is obtained by solving for in Eq. (29).
Remark 3.1
Whenever (), the coefficient in (29) is always positive and the coefficient is negative (positive). So, the signs of coefficients , and determine the number of possible positive real roots of polynomial in (29). This is investigated by employing Descarte’s rule of signs. Table 3 presents the various possibilities for the roots of when and .
Table 3.
Total number of possible real roots of polynomial (29)
| Cases | Coefficients of | Number of sign changes | Number of possible positive real roots | |||||
|---|---|---|---|---|---|---|---|---|
| 1 | 0 | 0 | ||||||
| 2 | − | 1 | 1 | |||||
| − | − | 1 | 1 | |||||
| − | − | − | 1 | 1 | ||||
| − | − | − | − | 1 | 1 | |||
| 3 | − | 2 | 0, 2 | |||||
| − | 2 | 0, 2 | ||||||
| − | − | 2 | 0, 2 | |||||
| − | 2 | 0, 2 | ||||||
| − | − | 2 | 0, 2 | |||||
| − | − | − | 2 | 0, 2 | ||||
| 4 | − | − | 3 | 1, 3 | ||||
| − | − | 3 | 1, 3 | |||||
| − | − | − | 3 | 1, 3 | ||||
| − | − | − | 3 | 1, 3 | ||||
| 5 | − | − | 4 | 0, 2, 4 | ||||
A look at Table 3, we deduce the following result summarizing the various possibilities of positive solutions of in Eq. (29).
Theorem 3.3
Suppose . Then, the vaccination dengue model (5) has
-
(i)
a unique EE whenever case 2 in Table 3 holds and ;
-
(ii)
more than one EE whenever and case 4 in Table 3 is satisfied;
-
(iii)
more than one EE when and cases 3 and 5 in Table 3 hold;
-
(iv)
no EE whenever and case 1 of Table 3 is satisfied.
In Theorem 3.3, it is clear from case (i) that model (5) has a unique EE whenever . In addition, case (iii) of the theorem suggests the possibility of the coexistence of DFE and EE for the vaccination dengue model (5), and hence the potential of the model exhibiting the phenomenon of backward bifurcation when .
Existence of Backward Bifurcation
Here, the center manifold theory (CMT) is used to explore the existence of backward bifurcation in model (5). CMT was popularized by Castillo-Chavez and Song [37] and has been applied to epidemiological models by many other researchers [14, 38, 39]. For convenience, we make changes in the state variables of the vaccination model (5) by setting , , , , , , , and . Let . Then, model (5) can be rewritten in the form , where , as follows:
| 30a |
| 30b |
| 30c |
| 30d |
| 30e |
| 30f |
| 30g |
| 30h |
| 30i |
with and . Take as a bifurcation parameter. Then, at from Eq. (22), is calculated as
The Jacobian of system (30), evaluated at the BRDFE and denoted by , is obtained as
| 31 |
where
The characteristic equation associated with Eq. (31), given by , gives a simple zero eigenvalue with other eight eigenvalues having negative real part. Thus, CMT can be used to analyze the dynamics of the vaccination dengue model (5) near [37]. Furthermore, a right eigenvector, , corresponding to the simple zero eigenvalue of can be determined by solving . Consequently,
| 32 |
Similarly, a left eigenvector, , associated with the simple zero eigenvalue of can be obtained in terms of from as
| 33 |
Using the result by Castillo-Chavez and Song [37] (see Theorem 4.1), we calculate the bifurcation coefficients and whose their signs determine the direction of bifurcation at as
where
and
It follows, by making use of the property , that
Obviously, the coefficient is positive since the model parameters are non-negative. Consequently, according to Theorem 4.1 in [37], the vaccination dengue model (5) will undergo backward bifurcation if the bifurcation coefficient is positive. This implies that model (5) will exhibit backward bifurcation if the following inequality holds:
| 34 |
In addition, if the inequality (34) is reversed, then the model exhibits a forward bifurcation phenomenon. Hence, the result in Theorem 3.4 holds.
Theorem 3.4
The vaccination dengue model (5) undergoes a backward bifurcation at whenever
If the reversed inequality holds, then the model exhibits a forward bifurcation at .
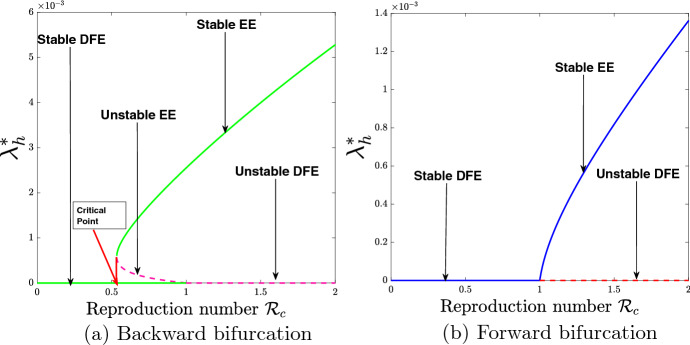
In a case when model (5) exhibits backward bifurcation, a stable DFE coexists with a stable EE at . So, there exists a critical value of , (say ) as indicated in Fig. 2a, such that for , the solution trajectories either attain the stable DFE or stable EE depending on the initial data. If it attains the stable DFE dengue disease will be eradicated, and if it attains the stable EE dengue will persist in the society. The epidemiological insight from the existence of backward bifurcation is that the well-known necessary requirement of is not sufficient for an effective control of the spread of dengue in the community.
Fig. 2.
Bifurcation diagrams for the vaccination model (5)
The backward and forward bifurcation diagrams associated with Theorem 3.4 are illustrated in Fig. 2. Figure 2a shows the existence of backward bifurcation using the parameter values given in Table 4, except , . The result indicates that during the era of backward bifurcation, reducing the control reproduction number, , below one will not be sufficient to eradicate the disease and that control measures should be applied to make be far below the critical point as shown in Fig. 2a. Figure 2b shows the existence of forward bifurcation by making use of the parameter values in Table 4, except , , . The result obtained indicates that during the era of forward bifurcation, reducing the control reproduction number, , below unity will be sufficient to eradicate the disease in the population.
Table 4.
Parameter values of the dengue model (35) and sources as applied to Johor 2012 dengue outbreak
Analysis of the Dengue Model Without Vaccination
To study the worst-case scenario where public health interventions such as vaccination are not implemented in the community, the reduced version of the vaccination dengue model (5) is given as
| 35a |
| 35b |
| 35c |
| 35d |
| 35e |
| 35f |
| 35g |
| 35h |
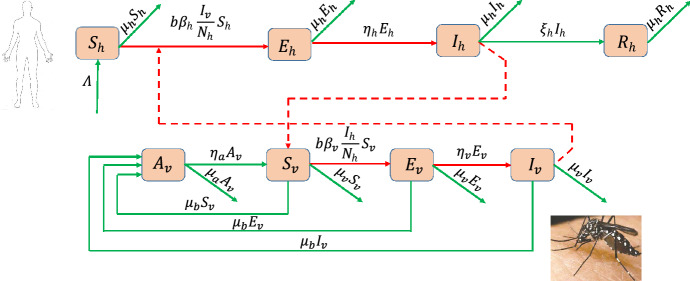
subject to initial conditions at time . The flow diagram describing the vector-host interactions for dengue disease transmission in the community is shown in Fig. 3.
Fig. 3.
Scheme of the SEIR + ASEI dengue model (35)
The dynamics of the dengue model (35) is analysed in the feasible region defined as
| 36 |
It can be shown that is a positive invariant set in respect of model (35).
Existence of Equilibria and Basic Reproduction Number
Considering the scenario of no control interventions for the steady state solutions of the dengue model studied in [23], it follows that the basic dengue model (35) has BRDFE, , given by
| 37 |
provided that .
Also, following the standard notation of NGM method, it can be shown that the basic reproduction number of the basic dengue model (35), represented by , is
| 38 |
where, .
It is easy to deduce from (22) and (38) that
| 39 |
Clearly, the effective reproduction number reduces to the basic reproduction number when vaccination is not administered in the human population (i.e., ) or when there is a very low level of vaccine efficacy () as indicated in (39). Contrarily, the basic reproduction number is decreased by a factor of in the presence of vaccination.
In addition to BRDFE , the dengue model (35) has a unique endemic equilibrium represented by
| 40 |
Let the respective human and mosquito forces of infection in model (35) at the steady state be defined by
| 41 |
and
| 42 |
Then, the components of in Eq. (40) are obtained as follows: Setting the right-hand sides of the equations in model (35) to zero, and solving (35a)–(35d) for , , and yields
| 43a |
| 43b |
| 43c |
| 43d |
In a similar manner, the solutions of (35f)–(35h) at a steady state for , and respectively are given by
| 44a |
| 44b |
| 44c |
Substituting (44) into (35e) and simplifying leads to the non-trivial solution for given by
| 45 |
Next, the results from (43)–(45) are substituted into the human force of infection expressed by (41) and simplified as follows:
| 46 |
Now, using (44c) and (46) in (41), we have
where . So,
| 47 |
The two forces of infections are perturbed by using (42) in (47) to obtain the quadratic polynomial governing the existence of the dengue-present equilibria as follows:
| 48 |
with
| 49 |
and
| 50 |
Using (49) and (50) in (48) gives
 |
implying that
Thus,
It follows that
| 51 |
where,
In Eq. (51), it is clear that , and is positive whenever and negative when . Thus, the positive solution of Eq. (41) depends on the value and . Consider the case . Then, Eq. (51) has two roots; positive and negative. If , then , so there exists a unique non-zero solution obtained as for . From this discussion, it can be deduced that the equilibria continuously depend on the basic reproduction number, , which gives the possibilities of existence of an interval to the left of on which two positive equilibria exist, and are obtained as
Moreover, there is no positive solution for Eq. (51) if and either or . So, no EE exists. Hence, we summarize the above discussion in the following result:
Theorem 3.5
The pre-intervention dengue model (35) has
-
(i)
a unique EE if and only if and ;
-
(ii)
a unique EE if and , or ;
-
(iii)
two EE if , and ;
-
(iv)
otherwise, no EE.
In Theorem 3.5, case (i) clearly shows that model (35) has a unique EE whenever . Furthermore, case (iii) of the theorem indicates the possibility of the co-existence of DFE and EE for the dengue model (35), and hence the potential of the model exhibiting backward bifurcation whenever .
Existence of Backward Bifurcation
Again, CMT [37] is employed to explore the possibility of the uncontrolled dengue model (35) exhibiting the phenomenon of backward bifurcation. For this purpose, consider the change in the variables of model (35) as , , , , , , , . Let , so that model (35) can be rewritten in the form , where , as follows:
| 52a |
| 52b |
| 52c |
| 52d |
| 52e |
| 52f |
| 52g |
| 52h |
with and . Take as a bifurcation parameter. Then, at from Eq. (38), is calculated as
| 53 |
The Jacobian of system (52), evaluated at the BRDFE and denoted by , is obtained as
| 54 |
The characteristic equation associated with Eq. (54), given by , gives a simple zero eigenvalue with other seven eigenvalues having negative real part. Thus, CMT can be used to analyze the dynamics of the uncontrolled dengue model (35) near [37]. Further, the right eigenvector of (54), , is determined from
implying that
| 55a |
| 55b |
| 55c |
| 55d |
| 55e |
| 55f |
| 55g |
| 55h |
Solving (55) for , , , , , and in terms of yields
| 56 |
Similarly, a left eigenvector corresponding to the simple zero eigenvalue of is obtained from
| 57 |
Solving the resulting system of equations from (57) for , , , , , and in terms of gives
| 58 |
By making use of the result of Theorem 4.1 in [37], the bifurcation coefficients and whose their signs determine the direction of bifurcation at are computed as
 |
and
It follows, using the identity , that
Clearly, the coefficient is positive since the parameters of model (35) are non-negative. It follows from Theorem 4.1 in [37] that the dengue model (35) will undergo backward bifurcation if the bifurcation coefficient is positive. Alternatively, model (35) will exhibit backward bifurcation if the following inequality holds:
 |
59 |
If the inequality in (59) is reversed, then the model exhibits a forward bifurcation phenomenon. Hence, Theorem 3.6 gives the summary of the foregoing analysis.
Theorem 3.6
The dengue vaccination-free model (35) undergoes a backward bifurcation at whenever
 |
If the reversed inequality holds, then the model exhibits a forward bifurcation at .
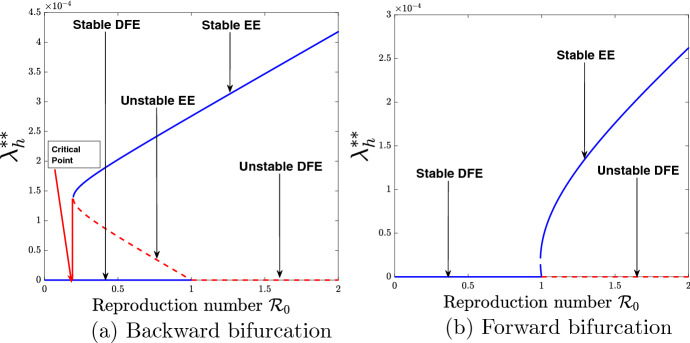
From epidemiological point of view, the implication of the existence of backward bifurcation is that the classical necessary requirement of the threshold inequality is not sufficient to effectively control the spread of dengue in the community. The bifurcation diagrams associated with Theorem 3.6 are demonstrated in Fig. 4.
Fig. 4.
Bifurcation diagrams for the vaccination-free model (35)
Figure 4a shows the graphical illustration of the existence of backward bifurcation with the use of parameter values seen in Table 4, except . The result indicates that during the era of backward bifurcation, reducing the basic reproduction number, , below one will not be sufficient to eradicate dengue disease and that much more control measures should be put in place to make be far below the critical point as shown in Fig. 4a. Figure 4b shows the existence of forward bifurcation by making use of the parameter values given in Table 4, except . A look at Fig. 4b indicates that during the era of forward bifurcation, reducing the basic (uncontrolled) reproduction number, , below unity will be sufficient to eradicate the disease in the community.
Parameter Estimation and Model Fitting
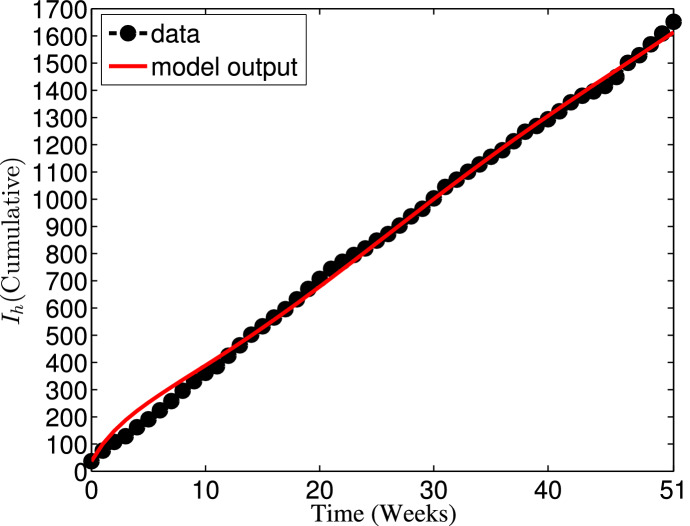
This section is concerned with the estimation of parameters of the basic dengue model (35) without vaccination based on the weekly reported data of 2012 dengue cases in Johor, Malaysia [40]. In this paper, the values for parameters such as recruitment rate of humans (), effective transmission probability per contact of susceptible humans with infectious mosquitoes , effective transmission probability per contact of susceptible mosquitoes with infectious humans (), infectiousness rate of humans (), recovery rate of humans (), maturation rate of aquatic mosquitoes () and rate of infectiousness of mosquitoes () are estimated, while the values of other parameters are chosen from the literature. To estimate the parameters, we employ the least squares method with a view to minimizing the sum of squared errors defined by subject to model (35), where is the reported data, and denotes the model solution corresponding to the cumulative number of reported cases over time t with the set of estimated parameters [41–43].
In 2012, the total population of Johor state of Malaysia was estimated as 3,247,700 [44–46]. Thus, the initial total population is taken as . The human natural death rate is estimated as per year [44], so that per week. Since , it is assumed that the limiting total human population when there is no disease is , so that per week. Moreover, the model is fitted to the real data along with the following ICs: , , , , , , and . The model fitting with cumulative reported number of cases is depicted in Fig. 5, while the corresponding values of the estimated parameters are given in Table 4. Consequently, the basic reproduction number value for the 2012 Johor dengue outbreak, using the expression in (38) along with the parameter values defined in Table 4, is approximately . From biological point of view, this estimated threshold value implies that dengue epidemic will invade the population.
Fig. 5.
Fitting of the dengue model (35) with the cumulative number of weekly reported dengue cases in Johor from January to December 2012
Sensitivity Analysis
To determine the model parameters most responsible for dengue disease transmission and spread in the interacting human and mosquito populations, this section explores the sensitivity analysis of models (5) and (35).
LoCal Sensitivity Analysis
According to [24, 42, 43, 48], local sensitivity analysis, based on the normalised sensitivity index of the effective reproduction number of model (5) is defined as
where is a generic parameter of the vaccinated dengue model (5). The sensitivity index is useful to measure the relative change in the response function when the parameter changes.
In particular, the computed analytical expression of the sensitivity index for in respect of the transmission probability of dengue from an infectious mosquito to susceptible human (), which is a constant value, is given as
In a similar manner, the sensitivity indices for the parameters of dengue models (5) and (35) using and respectively as response functions are computed and evaluated at the baseline parameter values given in Table 6. The results of the computation are presented in Table 5.
Table 6.
Table 5.
| Parameter | Sensitivity index |
|---|---|
| b | |
| K | |
It is observed from Table 5 that the sensitivity index is positive for some parameters of models (5) and (35), while it is negative for the other parameters of the models. The positive sign of the sensitivity index of and to the parameters of the corresponding models suggests that an increase in the value of each of the parameter in this class will result in an increase in the reproduction numbers ( and ), and vice versa. For instance, indicates that decreasing the parameter b (mosquito biting rate) by 10% will increase the reproduction numbers, and , by 10%, and the other way round. The negative sign of the sensitivity index, on the other hand, indicates that when the value of each parameter in this category is increased (or decreased), the basic reproduction numbers, and , decrease (or increase). Thus, sensitivity analysis of models (5) and (35) provides a very good insight into the dynamics of transmission, prevention and control of dengue disease. In particular, effort should be made to reduce the value of parameter with positive sensitivity index, while the value of parameter with negative sensitivity index should be increased at all cost when focusing on an appropriate intervention strategy for the prevention and control of dengue disease spread.
GlobAl Sensitivity Analysis
The input parameters govern the outputs of the compartmental mathematical models, which may possess some uncertainty in their selection or determination. Thus, using the idea in [14, 42, 43], global sensitivity analysis is carried out to examine the effect of uncertainty and the sensitivity of the numerical simulation outcomes to changes in each parameter of the dengue models (5) and (35). To do this, Latin Hypercube Sampling (LHS) and partial rank correlation coefficients (PRCC) are employed.
LHS is a statistical technique which obeys a stratified sampling without replacement. It is suitable for an efficient analysis of parameter variations across simultaneous uncertainty ranges in each parameter [14]. PRCC measures the strength of the relationship between the model outcome and the parameters, stating the degree of the effect that each parameter has on the outcome [14]. LHS matrices are generated by assuming that all the parameters of models (5) and (35) are uniformly distributed. A total of 1000 simulations of the models per LHS run are performed with reference to the baseline values of parameters defined in Table 6 and the ranges as 20% in either direction from the baseline values.
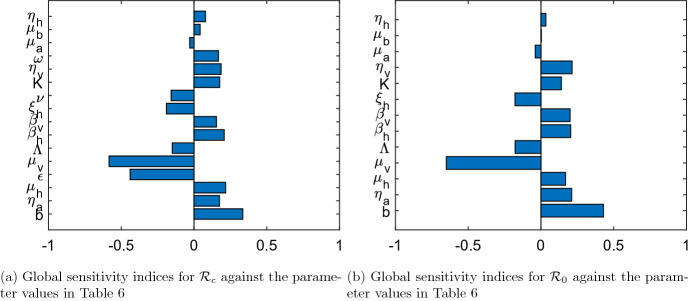
Figure 6 presents the PRCC values for the parameters of models (5) and (35) using the respective reproduction numbers and as the response functions. The parameters with highest PRCC values most impact the reproduction numbers as shown in Fig. 6. In agreement with the results obtained from the local sensitivity analysis of model parameters, the key parameters that influence and are categorized into two; those that have positive PRCC values and those that have negative sensitivity indices. An increase (or decrease) in each parameter value in the first category causes and to increase (or decrease), while and increase (or decrease) due to a decrease (or increase) in each parameter value in the second category.
Fig. 6.
PRCC values for the parameters of model (5) and model (35) using and as response functions respectively
It follows from Fig. 6a and b that the parameters that have negative influence on the dynamics of dengue disease transmission in the population are the mosquito natural death rate (), vaccine efficacy (), human recovery rate (), vaccination rate (), human recruitment rate () and larva natural mortality rate (). While the mosquito biting rate (b), larva maturity rate (), human natural death rate (), probability of dengue virus transmission per contact of an infectious mosquito with susceptible human (), transmission probability of dengue virus per contact of an infectious human with susceptible mosquito (), larvae carrying capacity (K), progression rate of dengue disease in mosquitoes (), vaccine waning rate (), oviposition rate of mosquitoes () and progression rate of dengue infection in humans () are the parameters that positively impact the reproduction numbers and of models (5) and (35) respectively. This is consistent with the results of local sensitivity analysis as summarized in Table 5.
Model with Multiple Interventions
Since the proposed vaccine in this study is imperfect (with assumed 90% maximum efficacy), then combining vaccination with other control mechanisms is more suitable. It is evident from the results of sensitivity analysis (as shown in Table 5) that a control intervention strategy that inhibits the host-vector contact, decreases the probability of dengue virus transmission per contact of with (), probability of dengue virus transmission per contact of with (), vaccine waning rate (), and increases the vaccination rate (), vaccine efficacy (), natural mosquito death rate () and human recovery rate () will significantly reduce dengue disease spread, or even lead to dengue-free population, in the community. Hence, three different control parameters are considered as follows:
-
(i)
The vaccination rate in model (5) is considered as to represent vaccination control.
-
(ii)
represents the rate of treatment of infectious humans (symptomatic patients). It consists of the use of paracetamol, corticosteroids and non-steroidal anti-inflammatory drugs. Depending on the human immune response, the efficacy of symptomatic treatments varies from one person to the other. The essence of this control is to enhance the infectious patients recovery rate. Suppose that the fraction of infectious individuals are given a timely supportive treatment so that they recover quickly at an incremental rate . Then, the enhanced recovery rate of infectious individuals becomes , where accounts for the proportion of effective treatment [49].
-
(iii)
accounts for the effort of mosquitoes adulticiding. The control focuses on the reduction of the size of female mosquito population. Thus the mosquito natural mortality rate becomes .
Note that the bounds: , , imposed on the three controls indicate that when (for ), it means that no effort is invested on the control . Also, implies that maximum effort is invested on the control .
Therefore, the three control parameters described above are incorporated into the dengue vaccination model (5), and the autonomous system describing the dynamics of dengue disease transmission with effect of multiple control interventions is given as
| 60a |
| 60b |
| 60c |
| 60d |
| 60e |
| 60f |
| 60g |
| 60h |
| 60i |
subject to suitable ICs given at time .
Existence of Equilibria and Reproduction Number
In line with the steady-state solutions of the dengue model (5), it is easy to show that model (60) has, in addition to a TE which coincides with of model (5) except that , a BRDFE () expressed as
| 61 |
if , where .
Also, it can be shown that the effective reproduction number of the dengue model (60), denoted as , is
| 62 |
where . The threshold given in (62) can be used to evaluate the impact of implementing the three controls , and in the bid to curtail dengue disease spread in the community.
Numerical Simulations, Results and Discussion
Numerical Simulations
To illustrate the impacts of vaccination (), treatment () and adulticide () controls on the dynamics of dengue disease population using different control combination strategies, the autonomous system (60) is numerically solved in MATLAB with ode45 solver based on the fourth-order Runge-Kutta method.
Initial conditions for the state variables of the dengue model (60) are taken to mimic the 2012 dengue outbreak in Johor. Keeping in mind that the total population of Johor, Malaysia is estimated at people in 2012 [44–46], we assume that no individual was vaccinated initially so that . Other initial conditions are taken as , , , , , , and [23]. In addition to the parameter values depicted in Table 4, the other parameter values used for the numerical simulations of model (60) is presented in Table 6. The simulation period is considered up to the final time weeks.
In the absence of control intervention implementation, the value of the basic reproduction number estimated in fourth section suggests that the threshold value, , is beyond the acceptable level. However, the implementation of different control strategies for the combination of vaccination, treatment and adulticide controls can help in lowering the epidemiological threshold to the acceptable value ().
Results
Impact of Vaccination, Treatment and Adulticide Controls on
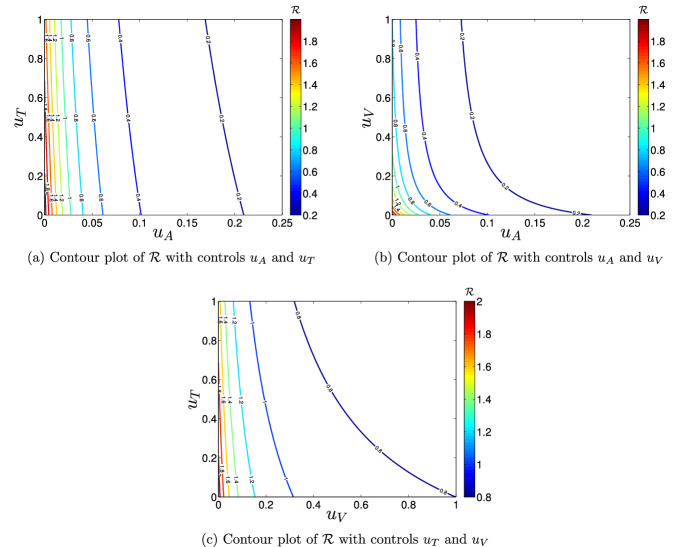
The numerical values of the expression in (62) is computed to evaluate the significance of implementing vaccination (), treatment () and adulticide () control measures in the bid to curtail or eradicate dengue disease in the community. Figure 7 demonstrates the impacts of three different control combination strategies on .
Fig. 7.
Contour plots of
It is observed that it is possible to put below the invasion level of dengue disease in the population (i.e., ), if about 90% of the symptomatic infectious individuals get timely treatment support and adulticiding is carried out at about 3% of the residential areas in the community (as shown in Fig. 7a). Figure 7b reveals that it is possible to reduce below one, if vaccination is administered on about 30% of the population and adulticide control is implemented in about 3% of the residential areas in the community. Further, the application of combined efforts of vaccination () and treatment () controls can help to reduce the value below unity, if about 90% of the symptomatic infectious individuals receive timely treatment support and about 32% of the population are vaccinated (see Fig. 7c).
Impact of Controls on the Population Dynamics
Here, seven different control strategies are used to analyse the efficacies of vaccination, treatment and adulticide control measures (, and , respectively) implementation on the dynamics human population and infectious mosquito subpopulation.
Strategy 1: Use of Vaccination Control () Only
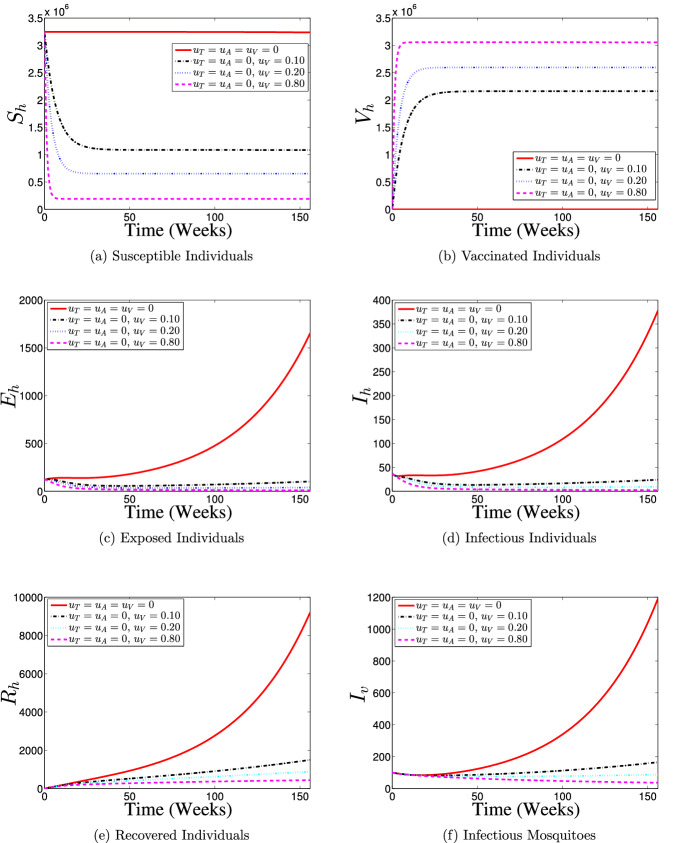
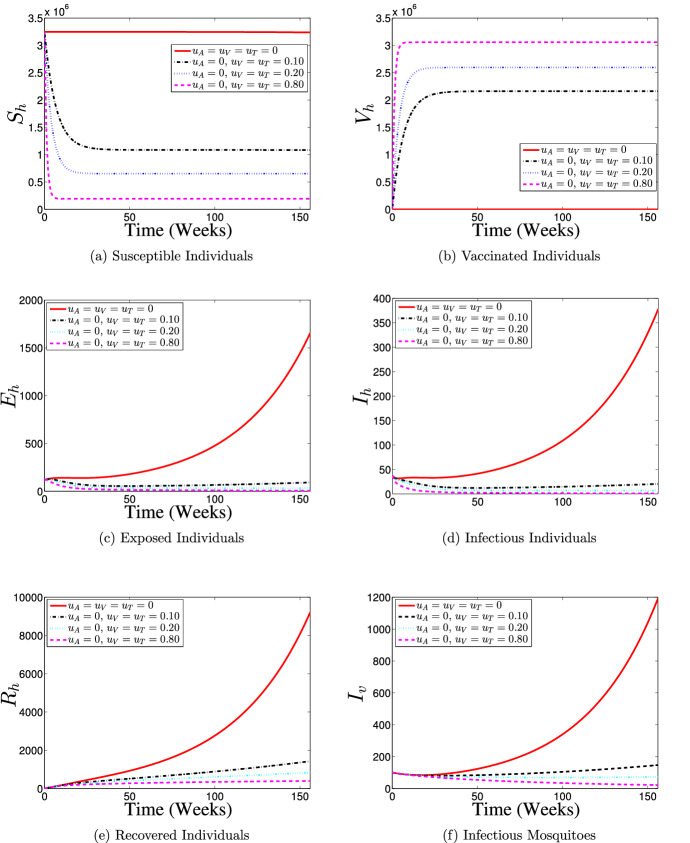
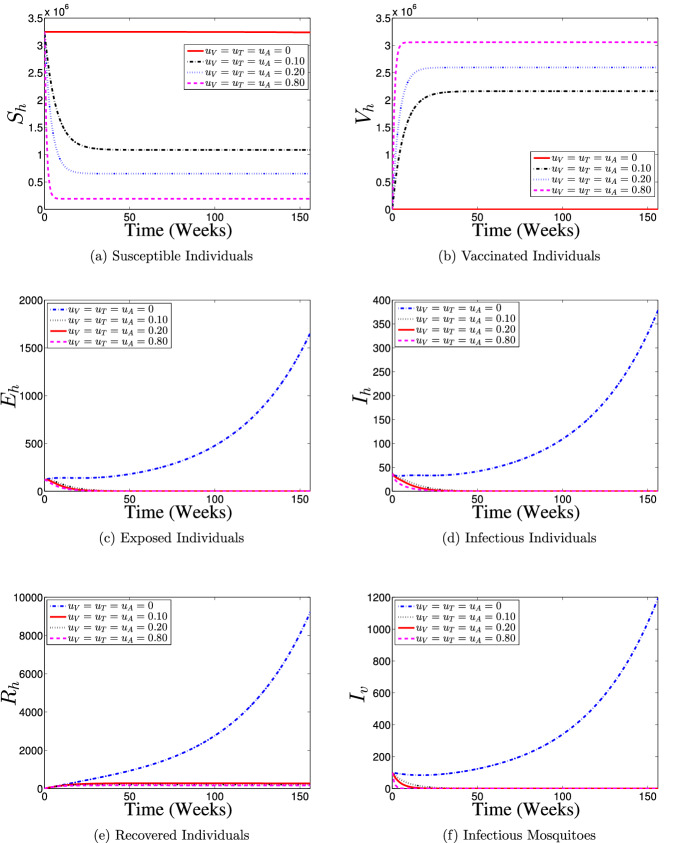
Figure 8 illustrates the results of the simulation of model (60) when only vaccination control intervention at different proportions is in use. With the implementation of vaccination control strategy, most of the susceptible individuals are either protected or vaccinated against dengue infection (as shown in Fig. 8a and b) thereby resulting into a fewer number of individuals at the risk of dengue infection (see Fig. 8c and d). Consequently, the numbers of individuals recovering from the disease infection drastically reduced as depicts in Fig. 8e. It is seen from Fig. 8f that the number of infectious mosquitoes reduced drastically with control implementation. This control strategy indicates that it is possible to achieve a dengue infection-free population if about 80% of the susceptible population is consistently vaccinated against the disease over the simulation period.
Fig. 8.
Dynamics of dengue model (5) with and without vaccination control () implementation
Strategy 2: Use of Treatment Control () Only
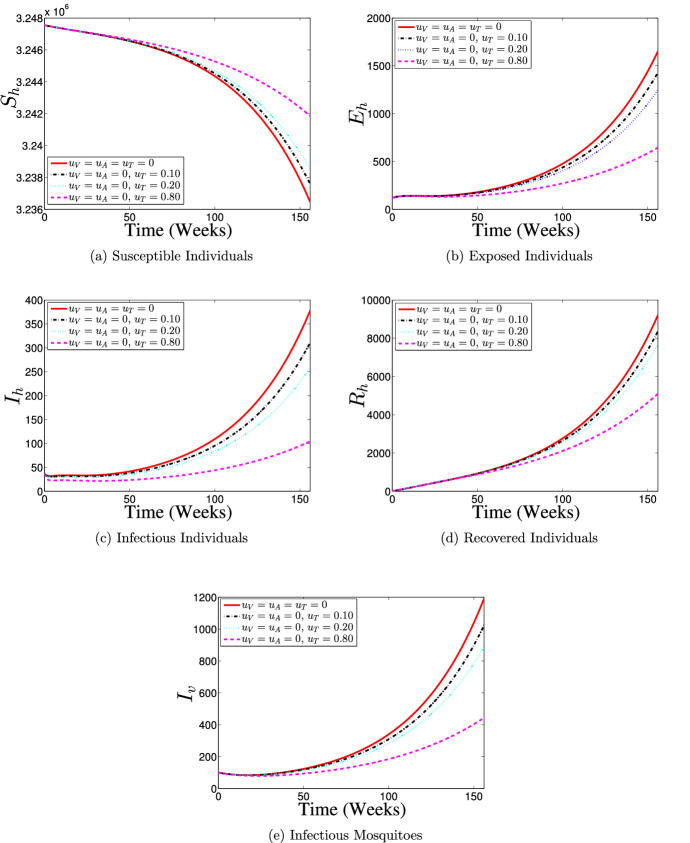
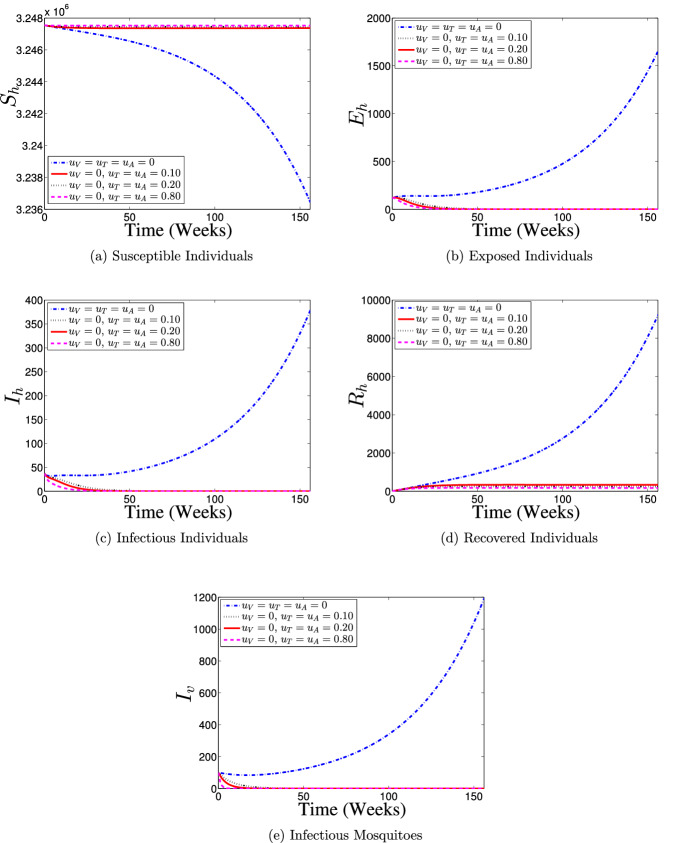
Figure 9 shows the effects of the application of various proportions of only treatment control () on the dynamics of dengue disease transmission and spread between the interacting human and mosquito populations. With the application of treatment control, the number of susceptible individuals considerably increases with an increasing level of control implementation between the 35th week and 156th week as reveals in Fig. 9a, the peak of infection reduces (see Fig. 9b and c), and the number of individuals recovering from the disease infection reduces (Fig. 9d). Figure 9e depicts that the number of dengue infections in mosquito population reduces when control is implemented. Overall, the results of simulations indicate that the use of only treatment control strategy may help in reducing dengue burden in the population (particularly if about 80% of infected individuals receive a timely treatment support), but only the effort is insufficient to eliminate dengue disease from the population.
Fig. 9.
Dynamics of dengue model (5) with and without treatment control () implementation
Strategy 3: Use of Adulticide Control () Only
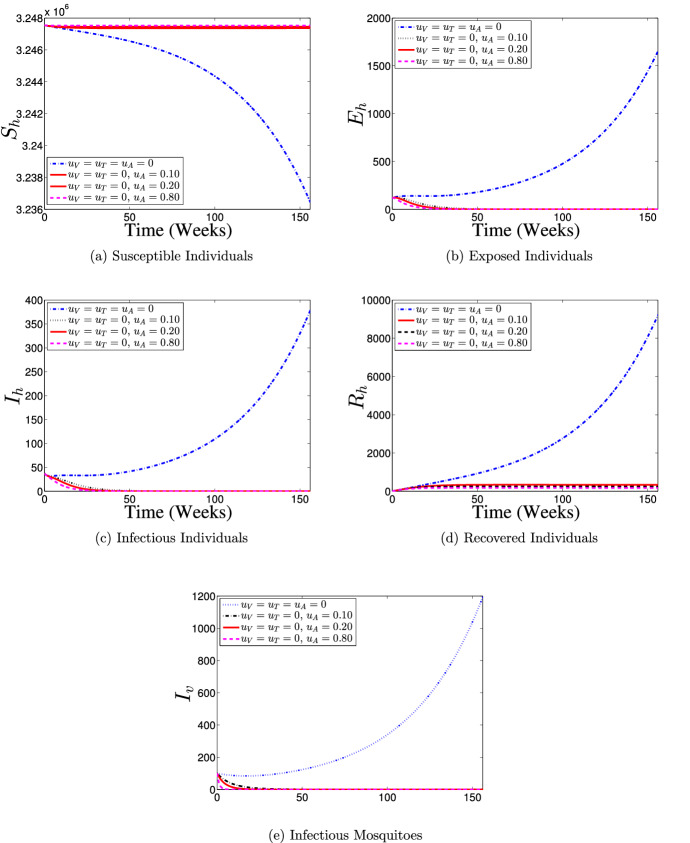
Furthermore, the effects of application of only adulticide control strategy () on the population dynamics of dengue disease is illustrated in Fig. 10. It is seen that with control implementation, the numbers of susceptible and recovered individuals are consistently held almost at the initial conditions over the simulation period (as shown in Fig. 10a and b), and the number of dengue-infected individuals diminishes to zero after about 20 weeks counting from the commencement of the control implementation (as shown in Fig. 10c and d) when compare with the case of no control implementation. Also, the number of infectious mosquitoes with control drastically diminishes to zero as against the number without control (see Fig. 10e). Therefore, this control intervention strategy suggests that, if about 10% of the residential areas in the community are covered with adulticide per week during a dengue outbreak, then it is possible to eradicate dengue in the population.
Fig. 10.
Dynamics of dengue model (5) with and without adulticide control () implementation
Strategy 4: Use of Vaccination and Treatment Controls () Only
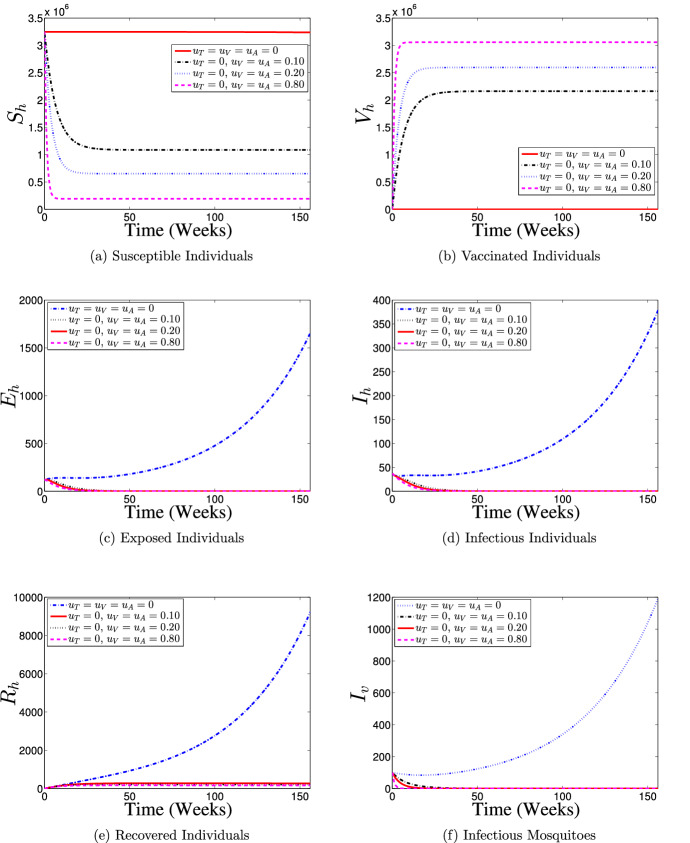
The effects of implementing a control strategy which combines the efforts of vaccination and treatment interventions on the dynamics of dengue disease transmission in the interacting populations is demonstrated in Fig. 11. The results obtained are similar to those when only vaccination intervention is put in place (Fig. 8). It is shown that with the use of the present control strategy, most of the susceptible individuals are either protected or vaccinated against dengue infection (see Fig. 11a and b) thereby leading to a fewer number of dengue infections in the population (see Fig. 11c and d), which eventually leads to fewer number of humans recovering from the disease infection as depicts in Fig. 11e when compare with no control implementation case. Also, it is observed from Fig. 11f that the size of infectious mosquito sub-population with control diminishes rapidly to zero in comparison with the situation of no control implementation. Hence, This control intervention strategy indicates that dengue-free population is possible if about 80% of the susceptible population is vaccinated against the disease and timely treatment support is given to about 80% of the symptomatic infectious individuals in the population on a weekly basis throughout the control implementation period.
Fig. 11.
Dynamics of dengue model (5) with and without combined use of vaccination () and treatment () controls
Strategy 5: Use of Vaccination and Adulticide Controls () Only
Figure 12 presents the results of simulations of model (60) with the effects of combination of vaccination and adulticide control measures on the transmission and spread dynamics of dengue in the interacting human and mosquito populations. It is observed that with the implementation of this control strategy, most of the susceptible individuals are either protected or vaccinated against dengue infection (as shown in Fig. 12a and b) thereby putting the numbers of exposed and infectious individuals to zero (see Fig. 12c and d) and constantly keeps the size of recovered individuals almost at the initial condition (Fig. 12e) when compare with the case without any control intervention. For the mosquito population, the size of infectious mosquito sub-population with control decreases to zero after about 5 weeks counting from the beginning of control intervention period. Thus, the control strategy reveals that if about 10% of the susceptible population is vaccinated and adulticiding is conducted in about 10% of the residential areas per week during dengue outbreak, then eradication of the disease in the population is possible.
Fig. 12.
Dynamics of dengue model (5) with and without combined application of vaccination () and adulticide () controls only
Strategy 6: Use of Treatment and Adulticide () Only
To illustrate the effects of treatment control intervention combined with the effort of adulticide control measure, model (60) is numerically simulated, and the results are given in Fig. 13. With control implementation, it is revealed that the sub-populations of susceptible and recovered individuals are constantly maintained close to the initial data (see Fig. 13a and b) leading to a drastic diminishing of the numbers of exposed and infectious individuals, and infectious mosquitoes to zero (as seen in Fig. 13c–e). It follows from the simulated results for this control strategy that a dengue-free population can be achieved by continuously giving a timely treatment support to about 10% of the symptomatic infectious individuals and carrying out adulticiding in about 10% of the residential areas of the community when a dengue outbreak occurs.
Fig. 13.
Dynamics of dengue model (5) with and without the combination of treatment () and adulticide () controls implementation only
Strategy 7: Use of Vaccination, Treatment and Adulticide Controls ()
Figure 14 demonstrates the results of the simulation of (60) with the effects of simultaneous implementation of vaccination, treatment and adulticide control interventions on the transmission and spread dynamics of dengue disease. It is seen that with the implementation of this control strategy, most of the susceptible individuals are either protected or vaccinated against dengue infection (as shown in Fig. 14a and b) thereby resulting into the numbers of exposed and infectious individuals being diminished to zero (see Fig. c and d), while a few number of individuals get recovered from the infection (Fig. 14e) in comparison with the case of no control application. Further, Fig. 14f shows that the number of infectious mosquitoes is held at zero from about 5th week after the commencement of control intervention till the end of intervention period when compare with the no control application scenario. Hence, this control strategy suggests that, if vaccination is administered on about 10% of the susceptible population, a timely treatment support is given to about 10% of the symptomatic infectious individuals and adulticiding is carried out in about 10% of the residential areas of the community per week, then it is possible to eradicate dengue in the population.
Fig. 14.
Dynamics of dengue model (5) with and without the combination of vaccination (), treatment () and adulticide () controls implementation only
Efficiency Analysis
In the current section, efficiency analysis is conducted in order to compare the control interventions Strategies 1 to 7 evaluated on the dynamics of dengue disease transmission and spread between the two interacting populations in this study. This helps us in our decision making on the best control intervention strategy for an effective control of dengue transmission and spread in the population. Following [21, 50, 51], we compare the effects of various possible strategies in reducing the size of symptomatic infectious individual subpopulation (). To this aim, the efficiency index, denoted as , is defined as [21, 50, 51]:
| 63 |
where, and measure the cumulative number of symptomatic infectious individuals in the population over the time interval with and without any control intervention strategies respectively, and weeks. Thus, the best control intervention strategy is the one with the biggest value.
Using the simulated results for the implementation of Strategies 1–7 in subsection “Impact of Controls on the Population Dynamics” and setting all the control parameters , and at 0.8(80%) and considering 90% vaccine efficacy (i.e., ), the results obtained from the efficiency analysis are given in Table 7.
Table 7.
Efficiency index
| Strategy | Cumulative number of | (%) | |||
|---|---|---|---|---|---|
| In absence of all the controls | − | 0 | |||
| Strategy 2: | − | 61.5828 | |||
| Strategy 1: | − | 95.0866 | |||
| Strategy 4: | − | 96.8886 | |||
| Strategy 3: | − | 97.9561 | |||
| Strategy 5: | − | 98.0742 | |||
| Strategy 6: | − | 98.5464 | |||
| Strategy 7: | − | 98.6282 | |||
It is shown in Table 7 that Strategy 7 (which combines vaccination, treatment and adulticide controls) most averts or reduces the number of symptomatic infectious individuals in the population, followed by Strategy 6 (combination of treatment and adulticide controls only), Strategy 5 (combination of vaccination and adulticide controls only), Strategy 3 (use of adulticide control only), Strategy 4 (which combines vaccination and treatment controls only), Strategy 1 (application of vaccination control only), and lastly Strategy 2 (the use of treatment control only).
Discussion
Dengue is the most prevalent viral infection transmitted principally via the bite of infected females Aedes aegypti mosquito leading to either a mild DF or DHF [14]. There are four distinct DENV serotypes (DENV-1, DENV-2, DENV-3 and DENV-4), which are all circulating in Malaysia [52]. Dengue is endemic in Malaysia, and has become a significant public health issue [52]. Since 2010, the number of reported dengue cases has continued to increase in the country [8], whereby Johor, Selangor, Kuala Lumpur and Putrajaya have been part of the mostly affected populations [40].
Malaysia has no licensed vaccine for dengue currently [8, 23]. To combat dengue epidemic in the country, the government of Malaysia has invested many efforts on vector control, case management and public enlightenment. It was reported that the government spent US$175.7 million on preventive activities and national dengue vector control program in 2010 [29]. However, there was a sudden rise in cases recently [53], indicating the ineffective of these intervention strategies.
In this study, we propose an appropriate deterministic model governed by an autonomous system of ODEs given in (5) to gain insightful information about the impact of administering an imperfect vaccine with waning immunity based on random mass vaccination scenario on the dynamics of dengue population in Johor, Malaysia. Qualitative analysis of the model suggests that the model with or without imperfect vaccination exhibits backward bifurcation phenomenon. This occurrence of backward bifurcation in the dynamics of dengue transmission makes the disease control more taxing.
We further perform both the local and global sensitivity analyses on model (5) and (35) (using the respective reproduction numbers and as response functions) to identify the key parameters that most influence the transmission and spread of dengue in the population. The results obtained from the analyses suggest that the most significant parameter that contributes to the transmission and spread of dengue disease among the positive sensitive parameters is mosquito biting rate (b). While the vaccine efficacy () and mosquito mortality rate () are the most significant negative sensitive parameters that influence the reproduction numbers and .
In particular, the spread of dengue in a population can be effectively curtailed by enhancing the human recovery rate and increasing the mortality rate of female mosquito. Thus, model (60) involving triplet controls (, and accounting for vaccination, treatment and adulticide controls) with constant rates is proposed. The associated reproduction number is computed. Using , it is graphically demonstrated that it is sufficient to put the basic reproduction number of model (35) below unity in the long run by continuously implementing a control strategy that combines any two of vaccination, treatment and adulticide interventions (see Fig. 7).
By investigating the effect of implementing the separate use and different combined efforts of the three control interventions in controlling the transmission of dengue in the population, it is found that the number of infectious (exposed and infected) considerably reduced in the population by implementing any of the seven strategies considered in this paper. Our results agree with the previous results reported in [14], which revealed that the use of optimal vaccination combined with the effort of optimal adulticide can reduce dengue prevalence in the community.
However, the results of efficacy analysis suggest that a strategy that combines the three control interventions (that is Strategy 7) is considered most effective, followed by Strategy 6 (the use of treatment and adulticide controls), Strategy 5 (simultaneous implementation implementation of vaccination and adulticide controls), Strategy 3 (implementation of adulticide control only), Strategy 4 (combined efforts of vaccination and treatment controls), Strategy 1 (administration of vaccination control only) and Strategy 2 (use of treatment control only), which is the least effective control (as shown in Table 7). Consequently, Strategy 7 indicates that if about 10% of the susceptible individuals is continuously vaccinated with about 10% of the symptomatic infectious individuals receiving timely treatment and open space spray of adulticide is carried out in about 10% of the residential areas in the community, then it is possible to eliminate dengue in the population. This shows that, even with low vaccination coverage, it is possible to quickly eliminate dengue in the population by combining vaccination with treatment and adulticide controls, which is an improvement over the result of the singular use of vaccination reported in [22], whereby the continuous administration of an imperfect vaccine on 80% of the population only reduces but insufficient to eliminate the susceptibility to dengue infection.
Conclusion
This section summarizes some of the major theoretical and epidemiological findings of this work. In this paper, an appropriately developed compartmental deterministic model governing a system of eight ODEs describing the vector-host interactions in the presence of vaccination for dengue disease transmission has been proposed and analysed. The pre-intervention version of the model has also been presented and some basic properties of it have been discussed. Furthermore, the vaccination dengue model has been modified to assess the impact of different strategies involving the use of at least one of the three control parameters accounting for vaccination, treatment and adulticide controls with constant rates on the dynamics of dengue disease population based on the 2012 dengue outbreak in Johor, Malaysia. From the theoretical analysis and numerical simulations, the following results are observed:
-
(i)
It was shown that the dengue model exhibits backward bifurcation whether imperfect vaccination property is present or not as both the dengue models with and without vaccination undergo the backward bifurcation phenomenon. Thus, bringing the basic reproduction number, , below unity is insufficient to secure an effective control or elimination of dengue disease in the community.
-
(ii)
Sensitivity analysis of the models suggests that mosquito biting rate (b), vaccine efficacy () and mosquito mortality rate () among other parameters are the most significant parameters that influence the epidemiological thresholds and .
-
(iii)By investigating the impact of vaccination (), treatment () and adulticide () control measures (based on the sensitivity analysis result) on the disease transmission and spread in the population, it is observed that
- Combining any two of controls , and reduces the reproduction number considerably below unity.
- The most efficient control strategy among the various control strategies analysed in this work is the strategy that combines vaccination, treatment and adulticide controls.
Therefore, the results of this study suggest that the Malaysian government and any other concerned authority should consider the implementation of a control strategy combining vaccination (when it becomes available) with the efforts of treatment and adulticide control to effectively control the transmission and spread of dengue and prevent the future occurrence of disease outbreak in Johor, Malaysia.
In the present work, we have used an autonomous system of ODEs to assess the impacts of different control strategies involving the use of at least one of the three control parameters (, and ) with constant rates on the dynamics of dengue disease transmission and spread in the population. However, further study can be conducted by analysing the impact of time-dependent controls , and based on some combination strategies using optimal control theory, and determination of the most cost-effective strategy is also of future interest by performing cost-effective analysis on the control strategies.
Acknowledgements
The authors are grateful to the handling editor and the anonymous referees for their constructive comments and suggestions.
Author Contributions
AA conceptualized the study, analyzed and interpreted the data, and contributed majorly in manuscript writing. NABA supervised, and contributed to further draft and manuscript editing. All authors read and approved the final manuscript.
Funding
Not applicable.
Availability of data and materials
The datasets generated and/or analyzed in this study can be reproduced using Fig. 5 or are available from the corresponding author on reasonable request.
Declaration
Conflict of interest
None.
Code availability
Matlab code is available from the corresponding author upon request.
Footnotes
Publisher's Note
Springer Nature remains neutral with regard to jurisdictional claims in published maps and institutional affiliations.
Contributor Information
Afeez Abidemi, Email: aabidemi@futa.edu.ng.
Nur Arina Bazilah Aziz, Email: nurarina@utm.my.
References
- 1.WHO Regional Office for South-East Asia: Comprehensive guidelines for prevention and control of dengue and dengue haemorrhagic fever. World Health Organization Regional Office for South-East Asia, Revised and Expanded edition (2011)
- 2.WHO: Global strategy for dengue prevention and control 2012–2020. World Health Organization. Geneva, Switzerland (2012)
- 3.WHO: Report of the meeting of the WHO/VMI workshop on dengue modeling: 25–26 August 2010, Geneva, Switzerland. World Health Organization, Technical report, Geneva (2011)
- 4.WHO: Dengue and severe dengue. Technical report, World Health Organization. Regional Office for the Eastern Mediterranean (2014)
- 5.Suppiah J, Ching SM, Amin-Nordin S, Mat-Nor LA, Ahmad-Najimudin NA, Low GKK, Abdul-Wahid MZ, Thayan R, Chee HY. Clinical manifestations of dengue in relation to dengue serotype and genotype in Malaysia: a retrospective observational study. PLoS Negl. Trop. Dis. 2018;12(9):e0006817. doi: 10.1371/journal.pntd.0006817. [DOI] [PMC free article] [PubMed] [Google Scholar]
- 6.Mia MS, Begum RA, Er AC, Abidin RDZRZ, Pereira JJ. Trends of dengue infections in Malaysia, 2000–2010. Asian Pac J Trop Med. 2013;6(6):462–466. doi: 10.1016/S1995-7645(13)60075-9. [DOI] [PubMed] [Google Scholar]
- 7.Abas N, Shamsuddin RM, Halim SA, Osman NS. Mathematical modelling of dengue pattern in Penang, Malaysia. J Adv Res Des. 2017;37:9–15. [Google Scholar]
- 8.Hamdan NI, Kilicman A. Analysis of the fractional order dengue transmission model: a case study in Malaysia. Adv Differ Equ. 2019;2019(1):31. doi: 10.1186/s13662-019-1981-z. [DOI] [Google Scholar]
- 9.Asamoah JKK, Yankson E, Okyere E, Sun G-Q, Jin Z, Jan R. Optimal control and cost-effectiveness analysis for dengue fever model with asymptomatic and partial immune individuals. Results Phys. 2021;31:104919. doi: 10.1016/j.rinp.2021.104919. [DOI] [Google Scholar]
- 10.Ooi EE, Gubler DJ. Dengue in Southeast Asia: epidemiological characteristics and strategic challenges in disease prevention. Cad. Saude Publica. 2009;25:S115–S124. doi: 10.1590/S0102-311X2009001300011. [DOI] [PubMed] [Google Scholar]
- 11.WHO: Dengue and severe dengue. http://www.who.int/mediacentre/factsheets/fs117/en/ (2018). Accessed 9 Jan 2019
- 12.Rodrigues HS, Monteiro MTT, Torres DFM. Vaccination models and optimal control strategies to dengue. Math. Biosci. 2014;247:1–12. doi: 10.1016/j.mbs.2013.10.006. [DOI] [PubMed] [Google Scholar]
- 13.Morales NLG, Núñez-López M, Ramos-Castañeda J, Velasco-Hernández JX. Transmission dynamics of two dengue serotypes with vaccination scenarios. Math. Biosci. 2017;287:54–71. doi: 10.1016/j.mbs.2016.10.001. [DOI] [PubMed] [Google Scholar]
- 14.Agusto FB, Khan MA. Optimal control strategies for dengue transmission in Pakistan. Math. Biosci. 2018;305:102–121. doi: 10.1016/j.mbs.2018.09.007. [DOI] [PubMed] [Google Scholar]
- 15.Lotka AJ. Contribution to the analysis of malaria epidemiology. Am. J. Hyg. 1923;3:1–121. [Google Scholar]
- 16.Ross R. The Prevention of Malaria. London: John Murray; 1911. [Google Scholar]
- 17.Esteva L, Vargas C. Analysis of a dengue disease transmission model. Math. Biosci. 1998;150(2):131–151. doi: 10.1016/S0025-5564(98)10003-2. [DOI] [PubMed] [Google Scholar]
- 18.Esteva L, Vargas C. A model for dengue disease with variable human population. J. Math. Biol. 1999;38(3):220–240. doi: 10.1007/s002850050147. [DOI] [PubMed] [Google Scholar]
- 19.Side S, Noorani MSM. Lyapunov function of SIR and SEIR model for transmission of dengue fever disease. Int. J. Simul. Process Model. 2013;8(2/3):177–184. doi: 10.1504/IJSPM.2013.057544. [DOI] [Google Scholar]
- 20.Abidemi A, Abd Aziz MI, Ahmad R. The impact of vaccination, individual protection, treatment and vector controls on dengue. Eng. Lett. 2019;27(3):613–622. [Google Scholar]
- 21.Abidemi, A., Fatoyinbo, H.O., Asamoah, J.K.K.: Analysis of dengue fever transmission dynamics with multiple controls: a mathematical approach. In: The 2020 International Conference on Decision Aid Sciences and Applications (DASA’20). IEEE, pp. 959–966 (2020)
- 22.Rodrigues HS, Monteiro MTT, Torres DFM. Dengue in Cape Verde: vector control and vaccination. Math. Popul. Stud. 2013;20(4):208–223. doi: 10.1080/08898480.2013.831711. [DOI] [Google Scholar]
- 23.Abidemi A, Aziz NAB. Optimal control strategies for dengue fever spread in Johor, Malaysia. Comput. Methods Programs Biomed. 2020;196:105585. doi: 10.1016/j.cmpb.2020.105585. [DOI] [PubMed] [Google Scholar]
- 24.Abidemi A, Abd Aziz MI, Ahmad R. Vaccination and vector control effect on dengue virus transmission dynamics: modelling and simulation. Chaos Solitons Fractals. 2020;133:109648. doi: 10.1016/j.chaos.2020.109648. [DOI] [Google Scholar]
- 25.Liang Y, Mohiddin A, Bahauddin R, Hidayatul FO, Nazni WA, Lee HL, Greenhalgh D. Modelling the effect of a novel auto-dissemination trap on the spread of dengue in Shah Alam and Malaysia. Comput. Math. Methods Med. 2019;2019:15. doi: 10.1155/2019/1923479. [DOI] [PMC free article] [PubMed] [Google Scholar]
- 26.Side S, Noorani MSM. SEIR model for transmission of dengue fever in Selangor Malaysia. Int. J. Mod. Phys. Conf. Ser. 2012;9:380–389. doi: 10.1142/S2010194512005454. [DOI] [Google Scholar]
- 27.Side S, Noorani MSM. A SIR model for spread of dengue fever disease (simulation for South Sulawesi, Indonesia and Selangor, Malaysia) World J. Model. Simul. 2013;9(2):96–105. [Google Scholar]
- 28.Packierisamy PR, Ng CW, Dahlui M, Venugopalan B, Halasa YA, Shepard DS. The cost of dengue vector control activities in Malaysia by different service providers. Asia Pac. J. Public Health. 2015;27(8–suppl):73S–78S. doi: 10.1177/1010539515589339. [DOI] [PubMed] [Google Scholar]
- 29.Packierisamy PR, Ng CW, Dahlui M, Inbaraj J, Balan VK, Halasa YA, Shepard DS. Cost of dengue vector control activities in Malaysia. Am. J. Trop. Med. Hyg. 2015;93(5):1020–1027. doi: 10.4269/ajtmh.14-0667. [DOI] [PMC free article] [PubMed] [Google Scholar]
- 30.Kumarasamy V. Dengue fever in Malaysia: time for review? Med. J. Malays. 2006;61(1):1–3. [PubMed] [Google Scholar]
- 31.Shafie AA, Yeo HY, Coudeville L, Steinberg L, Gill BS, Jahis R, Amar-Singh HSS. The potential cost effectiveness of different dengue vaccination programmes in Malaysia: a value-based pricing assessment using dynamic transmission mathematical modelling. Pharmacoeconomics. 2017;35(5):575–589. doi: 10.1007/s40273-017-0487-3. [DOI] [PubMed] [Google Scholar]
- 32.Mishra A, Gakkhar S. Non-linear dynamics of two-patch model incorporating secondary dengue infection. Int. J. Appl. Comput. Math. 2018;4(1):1–22. doi: 10.1007/s40819-017-0460-z. [DOI] [PMC free article] [PubMed] [Google Scholar]
- 33.Ndii MZ, Anggriani N, Messakh JJ, Djahi BS. Estimating the reproduction number and designing the integrated strategies against dengue. Results Phys. 2021;27:104473. doi: 10.1016/j.rinp.2021.104473. [DOI] [Google Scholar]
- 34.Hethcote, H.W.: The basic epidemiology models: models, expressions for , parameter estimation, and applications. In Mathematical Understanding of Infectious Disease Dynamics. World Scientific, pp. 1–61 (2009)
- 35.van den Driessche P, Watmough J. Reproduction numbers and sub-threshold endemic equilibria for compartmental models of disease transmission. Math. Biosci. 2002;180(1):29–48. doi: 10.1016/S0025-5564(02)00108-6. [DOI] [PubMed] [Google Scholar]
- 36.Hethcote HW, Thieme HR. Stability of the endemic equilibrium in epidemic models with subpopulations. Math. Biosci. 1985;75(2):205–227. doi: 10.1016/0025-5564(85)90038-0. [DOI] [Google Scholar]
- 37.Castillo-Chavez C, Song B. Dynamical models of tuberculosis and their applications. Math. Biosci. Eng. 2004;1(2):361–404. doi: 10.3934/mbe.2004.1.361. [DOI] [PubMed] [Google Scholar]
- 38.Asamoah JKK, Nyabadza F, Jin Z, Bonyah E, Khan MA, Li MY, Hayat T. Backward bifurcation and sensitivity analysis for bacterial meningitis transmission dynamics with a nonlinear recovery rate. Chaos Solitons Fractals. 2020;140:110237. doi: 10.1016/j.chaos.2020.110237. [DOI] [Google Scholar]
- 39.Olaniyi S, Okosun KO, Adesanya SO, Lebelo RS. Modelling malaria dynamics with partial immunity and protected travellers: optimal control and cost-effectiveness analysis. J. Biol. Dyn. 2020;14(1):90–115. doi: 10.1080/17513758.2020.1722265. [DOI] [PubMed] [Google Scholar]
- 40.Ministry of Health Malaysia. MOH denggue mortality 2010–2015. http://www.data.gov.my. Accessed 12 Jan 2019
- 41.Olaniyi S, Obabiyi OS, Okosun KO, Oladipo AT, Adewale SO. Mathematical modelling and optimal cost-effective control of COVID-19 transmission dynamics. Eur. Phys. J. Plus. 2020;135:938. doi: 10.1140/epjp/s13360-020-00954-z. [DOI] [PMC free article] [PubMed] [Google Scholar]
- 42.Asamoah JKK, Owusu MA, Jin Z, Oduro FT, Abidemi A, Gyasi EO. Global stability and cost-effectiveness analysis of COVID-19 considering the impact of the environment: using data from Ghana. Chaos Solitons Fractals. 2020;140:110103. doi: 10.1016/j.chaos.2020.110103. [DOI] [PMC free article] [PubMed] [Google Scholar]
- 43.Asamoah JKK, Jin Z, Sun G-Q, Seidu B, Yankson E, Abidemi A, Oduro FT, Moore SE, Okyere E. Sensitivity assessment and optimal economic evaluation of a new COVID-19 compartmental epidemic model with control interventions. Chaos Solitons Fractals. 2021;146:110885. doi: 10.1016/j.chaos.2021.110885. [DOI] [PMC free article] [PubMed] [Google Scholar]
- 44.Ministry of Health Malaysia. Health facts 2014. http://www.moh.gov.my. Accessed 15 Mar 2018
- 45.Department of Statistics Malaysia. Mid-year population estimates by age group, sex and state, Malaysia, 2012. http://www.data.gov.my. Accessed 20 May 2018
- 46.Department of Statistics Malaysia. Population quick info. http://pqi.stats.gov.my. Accessed 20 May 2018
- 47.Manore CA, Hickmann KS, Xu S, Wearing HJ, Hyman JM. Comparing dengue and chikungunya emergence and endemic transmission in A. aegypti and A. albopictus. J. Theor. Biol. 2014;356:174–191. doi: 10.1016/j.jtbi.2014.04.033. [DOI] [PMC free article] [PubMed] [Google Scholar]
- 48.Rodrigues HS, Monteiro MTT, Torres DFM. Seasonality effects on dengue: basic reproduction number, sensitivity analysis and optimal control. Math. Methods Appl. Sci. 2016;39(16):4671–4679. doi: 10.1002/mma.3319. [DOI] [Google Scholar]
- 49.Moulay D, Aziz-Alaoui MA, Kwon HD. Optimal control of chikungunya disease: larvae reduction, treatment and prevention. Math. Biosci. Eng. 2012;9(2):369–392. doi: 10.3934/mbe.2012.9.369. [DOI] [PubMed] [Google Scholar]
- 50.Carvalho SA, da Silva SO, da Cunha Charret I. Mathematical modeling of dengue epidemic: control methods and vaccination strategies. Theory Biosci. 2019;138(2):223–239. doi: 10.1007/s12064-019-00273-7. [DOI] [PubMed] [Google Scholar]
- 51.Abidemi A, Zainuddin ZM, Aziz NAB. Impact of control interventions on COVID-19 population dynamics in Malaysia: a mathematical study. Eur. Phys. J. Plus. 2021;136:237. doi: 10.1140/epjp/s13360-021-01205-5. [DOI] [PMC free article] [PubMed] [Google Scholar]
- 52.Che-Him N, Kamardan MG, Rusiman MS, Sufahani S, Mohamad M. Spatio-temporal modelling of dengue fever incidence in Malaysia. J. Phys. Conf. Ser. 2018;995:012003. doi: 10.1088/1742-6596/995/1/012003. [DOI] [Google Scholar]
- 53.Ministry of Health Malaysia. Annual report Ministry of Health Malaysia 2017. Technical report (2017)
Associated Data
This section collects any data citations, data availability statements, or supplementary materials included in this article.
Data Availability Statement
The datasets generated and/or analyzed in this study can be reproduced using Fig. 5 or are available from the corresponding author on reasonable request.


