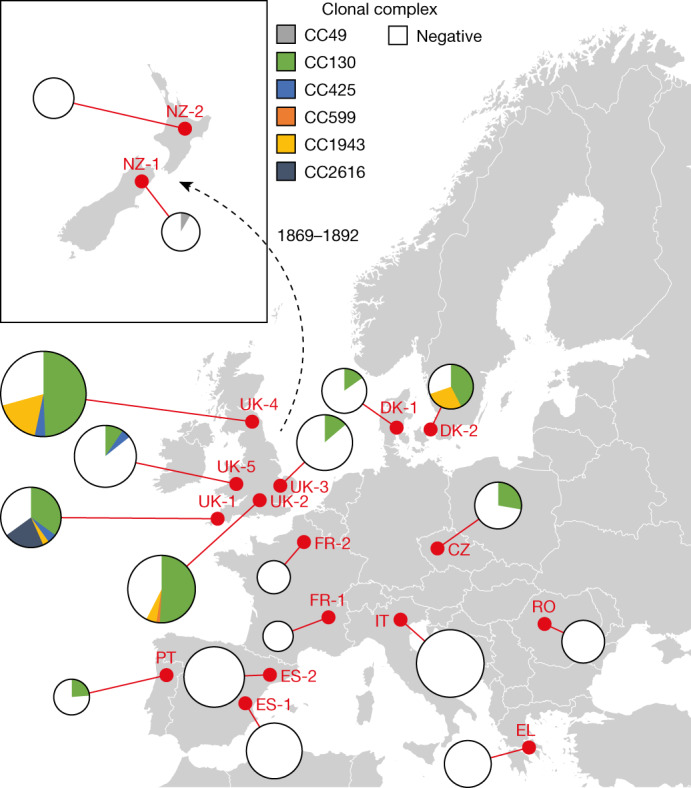
Fig. 1. Distribution of mecC-MRSA clones in European and New Zealand hedgehog samples.

The analysis included 828 samples from the nasal area, skin and feet of 276 hedgehogs originating from 16 wildlife rescue centres in 10 European countries and 2 wildlife rescue centres in New Zealand. The red dots indicate the sampling locations. The pie charts are connected to the sampling locations by a red line. The area of the pie chart is proportional to the number of samples from that location. The introduction of European hedgehogs into New Zealand from the UK between 1869 and 1892 is shown. A detailed description of the results is provided in Extended Data Fig. 1. Maps were provided by Eurostat under a Creative Commons Attribution 4.0 International (CC BY 4.0) licence; the administrative boundaries are copyright of EuroGeographics.
