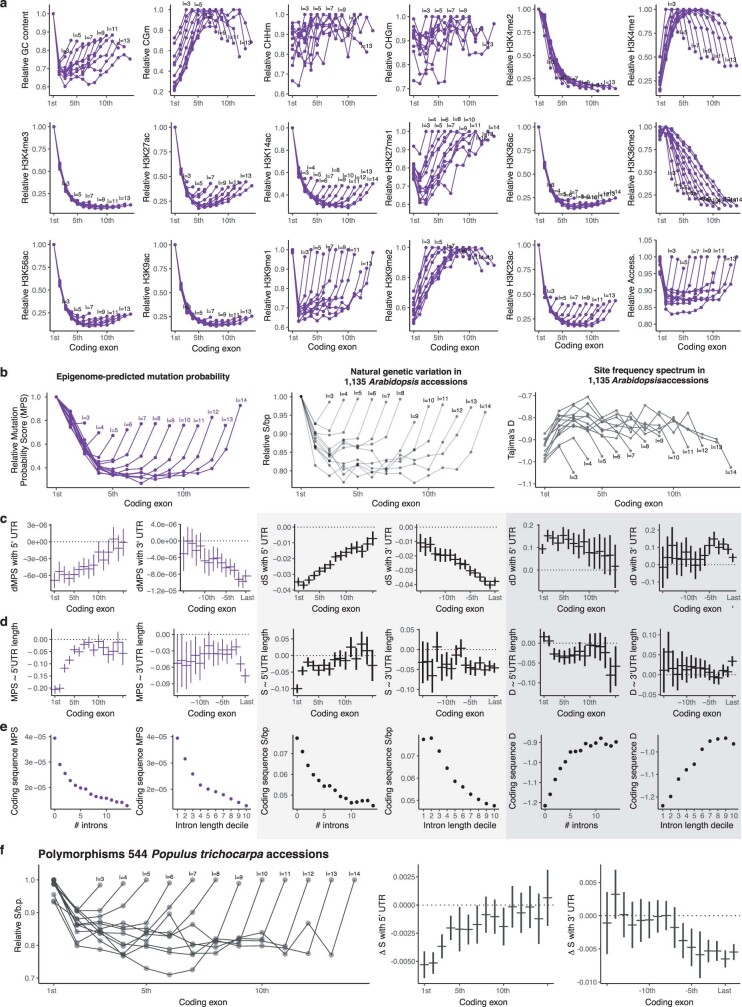
Extended Data Fig. 7. Relationships between untranslated regions or introns and mutation rates.
a, Distribution of epigenomic features in genes with different numbers of exons. b, Epigenome-predicted Mutation Probability Score (MPS), rates of natural polymorphism, and Tajima’s D in genes with different numbers of exons. c, Left: comparison of Mutation Probability Score (MPS) between genes with UTRs and those lacking 5’ or 3’ UTRs. Horizontal lines mark the mean difference between genes with and without UTRs. Vertical lines mark the mean +- confidence intervals of two-sided t-tests. Center: rates of natural polymorphism in natural A. thaliana accessions. Right: Tajima’s D in natural accessions. (n = 35,526 gene models). d, Left: Pearson’s correlation coefficients for relationship between predicted mutation probabilities and the absolute length of 5’ and 3’ UTRs. Horizontal lines mark the means, and vertical lines mark the mean +- confidence intervals. Center: same for rates of natural polymorphism in natural accessions. Right: same for Tajima’s D in natural accessions. (n = 35,526 gene models). e, Left: Relationships between intron number and total intron length with predicted mutation probabilities. Points indicate mean values. Center: same for rates of natural polymorphism in natural accessions. Right: same for Tajima’s D in natural accessions. f, Results for 544 Populus trichocarpa accessions75. Horizontal lines mark the means, and vertical lines mark the mean ± confidence intervals of two-sided t-tests (n = 73,013 gene models).

