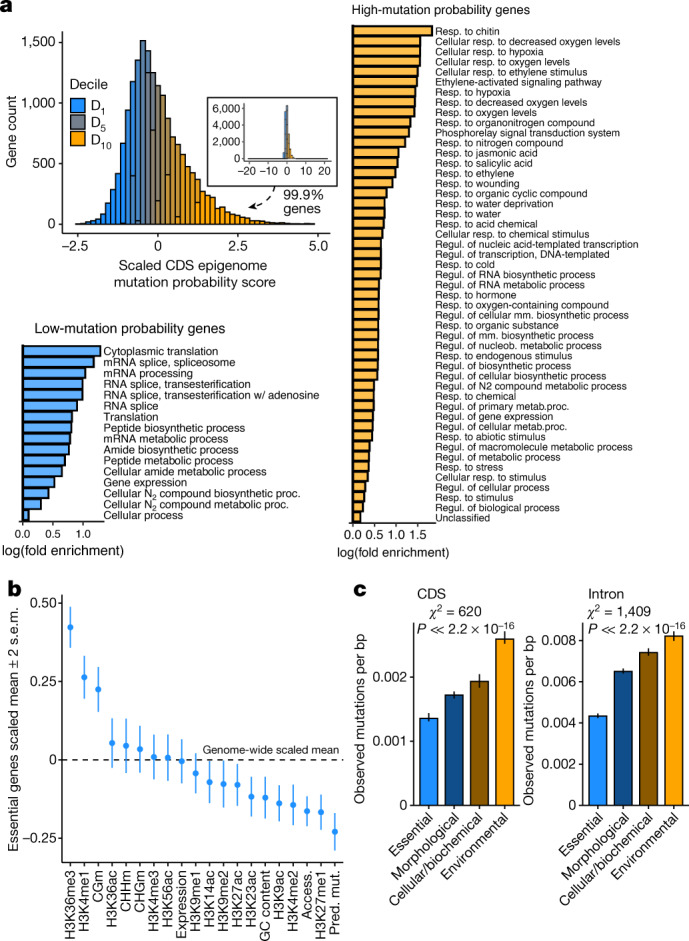
Fig. 3. Lower mutation probability in essential genes.

a, Variation in epigenome-derived mutation probability scores in coding sequence (CDS) among genes and gene ontology terms enriched in genes in the top (‘high-mutation probability genes’) and bottom (‘low-mutation probability genes’) deciles. Mm., macromolecular; N2, nitrogen; nucleob., nucleobase-containing compound; reg., regulation; resp., response. b, Enrichment of epigenomic and other features in coding sequences of 719 genes known to be essential from mutant analyses (mean ± 2 s.e.m.). c, Total observed mutation rate (±2 s.e.m., bootstrapped) in genes (n = 2,339) with experimentally determined functions38. The bars are coloured according to relative differences in mutation rates among genes classified by function (that is, orange refers to high mutation rate and blue represents low mutation rate). P ≈ 0 for both CDS and intron mutations.
