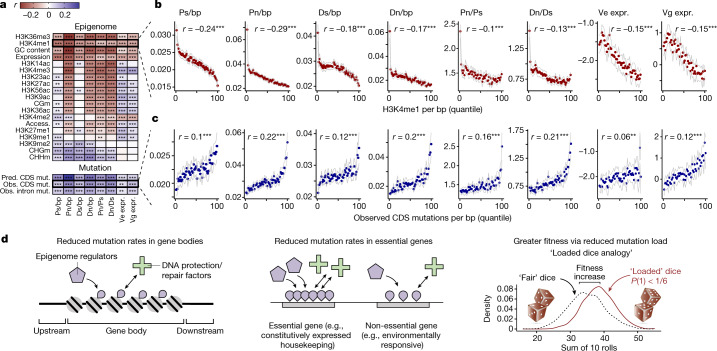
Fig. 4. Adaptive reduction in deleterious mutations.
a, Correlations between epigenomic and other features, predicted and observed mutation rates, and measures of evolutionary constraint and rates of sequence evolution. Synonymous (Ps) and non-synonymous polymorphism (Pn) in natural populations, synonymous (Ds) and non-synonymous divergence (Dn) from Arabidopsis lyrata, environmental variance of gene expression (Ve expr.) and genetic variance of gene expression (Vg expr.). ‘Pred. mut.’ is the predicted mutation rate as a function of epigenomic and other features. ‘Obs. mut.’ is the observed mutation rate in genes based on de novo mutations called across all mutation accumulation datasets. ***P < 2 × 10¹⁶, **P < 0.05. b, c, Relationship between H3K4me1 (b) and estimates of evolutionary constraint and rate of sequence evolution (c) across quantiles of observed mutation rates per gene. Pearson correlation reflects raw correlation across genes. Data are visualized by mean values ± 2 s.e.m. in 50 quantiles (each quantile = 2% of genes). d, Conceptual diagrams summarizing our findings.

