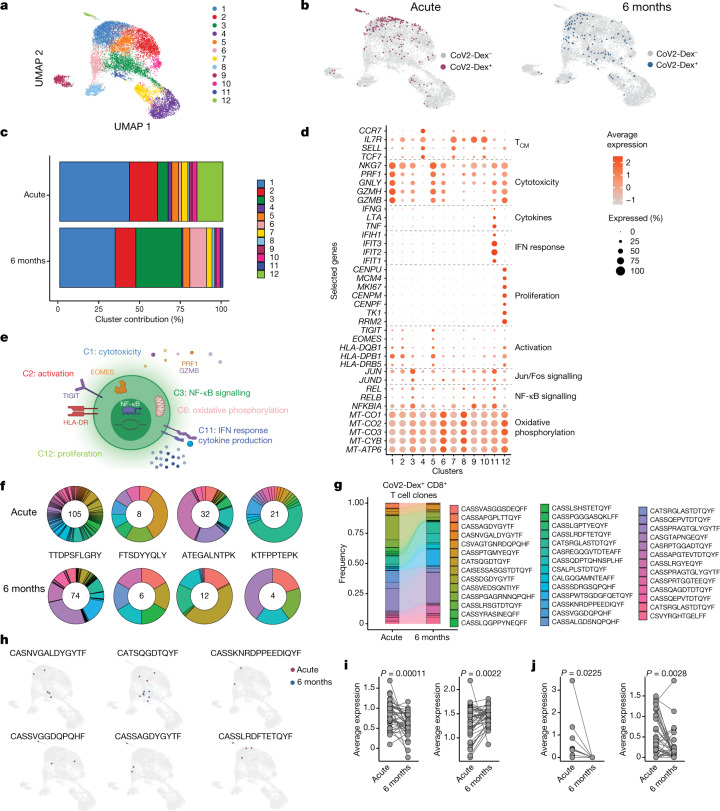
Fig. 2. Transcriptional makeup of SARS-CoV-2-specific CD8+ T cell clones.
a, Single-cell transcriptomes of CD8+ T cells displayed by UMAP. Seurat-based clustering of 14,853 cells, coloured based on cluster ID. b, UMAP as in a; CoV2-Dex+ cells from the acute infection (red) and 6 months after infection (blue) are highlighted. c, Cluster composition of CoV2-Dex+CD8+ T cells in acute infection versus 6 months after infection. d, Average expression (colour scale) and the percentage of expressing cells (size scale) of selected genes in indicated clusters. e, Schematic summary of the main clusters differentially represented in acute infection and 6 months after infection. f, Clonotype distribution in CoV2-Dex+ T cell clones (at least one CoV2-Dex+ cell per clone) for each of the four epitopes assessed. The number of T cell clones specific for the indicated epitopes at acute infection (top) and 6 months after infection (bottom) is provided within the circle. g, Alluvial plot showing relative representation of single clones present during acute infection and 6 months after infection (n = 41). h, UMAP as in a; cells from individual CoV2-Dex+CD8+ T cell clones in acute infection (red) and 6 months after infection (blue) are highlighted. i, Gene signature scores of individual CD8+ T cell clones in acute infection (acute gene signature, left) versus 6 months after infection (recovery gene signature, right) (n = 41). j, Expression of MKI67 (left) and HLA-DRB5 (right) in individual CD8+ T cell clones in acute infection versus 6 months after infection (n = 41). P values were calculated using a Wilcoxon signed-rank test in i and j.

