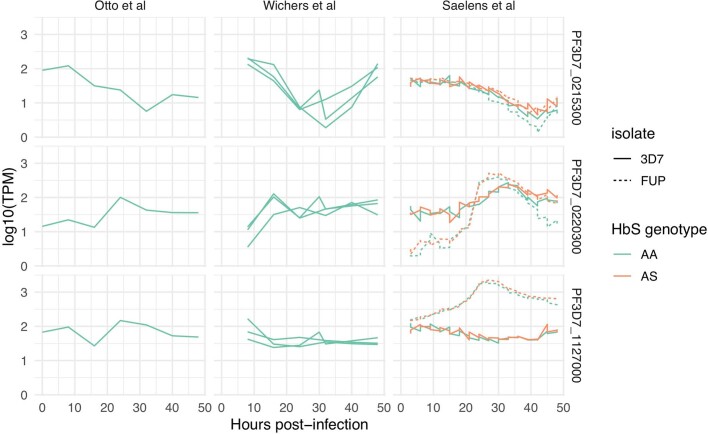
Extended Data Fig. 7. Estimated abundance of Pfsa region gene transcripts from in vitro intraerythrocytic time course experiments.
Plot shows the estimated relative transcript abundance (log10 TPM, y axis) against hours post-infection of erythrocytes (x axis) for the three Pfsa region genes containing nonsynonymous sickle-associated polymorphisms (Supplementary Table 1). Data is from three studies which analysed the 3D7 isolate (Otto et al58, Wichers et al59 and Saelens et al16) as indicated by columns; the Saelens et al study also analysed the FUP/H isolate (dashed lines). Time points can be roughly interpreted58 as: ring stage (~0-16h post-invasion); trophozoite stage (16-40h post-invasion); schizont stage (40-48h post-invasion). Replicate experiments are indicated by multiple lines in each panel; colours indicate the HbS genotype of the erythrocytes used as noted in the legend. TPM values are estimated based on reads aligning to the 3D7 reference genome; for the Saelens et al study these were used as reported previously while for the other studies we recomputed TPM as described in Methods.

