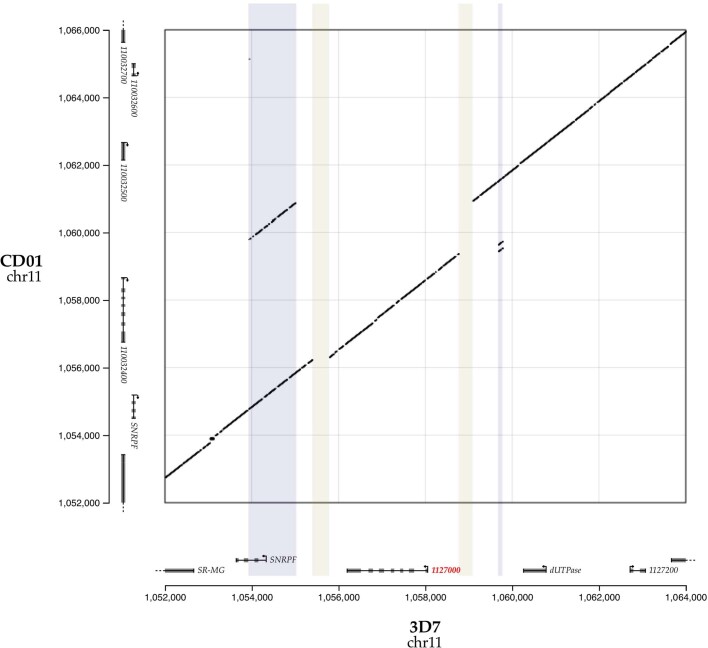
Extended Data Fig. 9. Structural variation at the Pfsa3 locus.
Plot shows all DNA segments of length 50 (50-mers) that are shared identically between the 3D7 genome assembly (x axis) and CD01 genome assembly38 (y axis) in the Pfsa3 region. Points near the diagonal indicate similar structure, while sequences of off-diagonal points indicate structural differences between genomes. Coloured regions indicate approximate regions of 3D7 that contain increased copy number (light blue) or deletions (light yellow) in CD01 relative to 3D7. Segment endpoints are determined by inspection of shared kmer locations and are: 1,053,925 - 1055024 (duplication); 1,055,395-1,055,784 (deletion); 1,058,765-1,059,087 (deletion); 1,059,675-1,059,777 (triplication). The CD01 assembly carries Pfsa1+, Pfsa2+ and Pfsa3+ alleles. Comparisons of 3D7 to other available assembled Pf genomes in Pfsa regions can be found in Supplementary Fig. 3.

