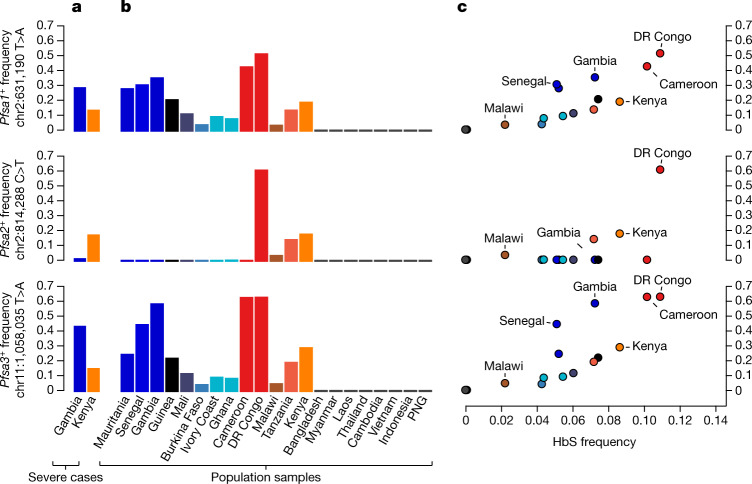
Fig. 3. The relationship between Pfsa and HbS allele frequencies across populations.
a, Bars show the estimated frequency of each Pfsa+ allele in severe cases of malaria from each country. Details of allele frequencies and sample counts across years are presented in Extended Data Fig. 5. b, Estimated frequency of each Pfsa+ allele in worldwide populations from the MalariaGEN Pf6 resource11, which contains samples collected during the period 2008–2015. Only countries with at least 50 samples are shown (this excludes Columbia, Peru, Benin, Nigeria, Ethiopia, Madagascar and Uganda). c, Estimated population-level Pfsa+ allele frequency (as in a, b) against HbS allele frequency in populations from MalariaGEN Pf6 (coloured as in b; selected populations are also labelled). Pfsa+ allele frequencies were computed from the relevant genotypes, after excluding mixed or missing genotype calls. HbS allele frequencies were computed from frequency estimates previously published by the Malaria Atlas Project17 for each country, by averaging over the locations of MalariaGEN Pf6 sampling sites weighted by the sample size. DR, Democratic Republic; PNG, Papua New Guinea.

