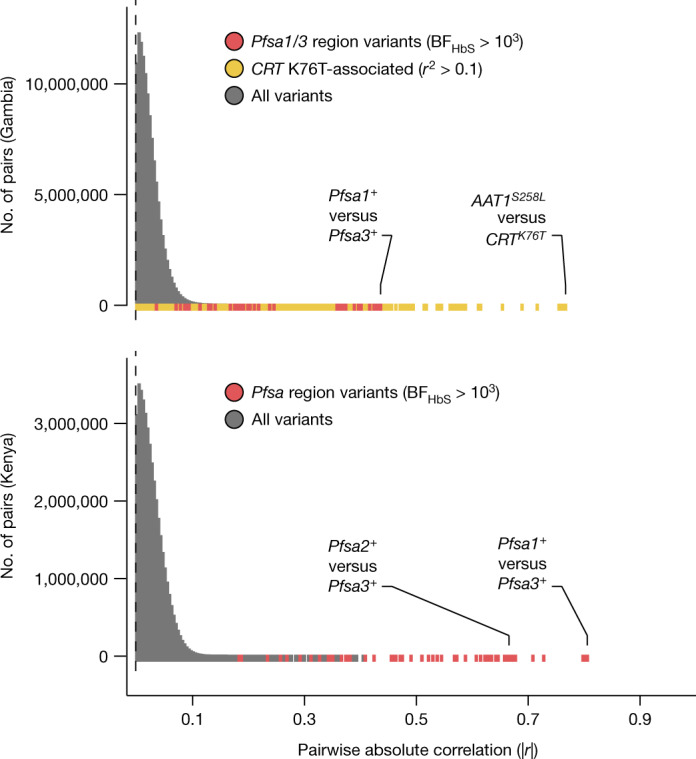
Fig. 4. HbS-associated variants show extreme between-chromosome correlation in severe P. falciparum infections.

Empirical distribution of absolute genotype correlation (|r|) between pairs of variants on different P. falciparum chromosomes in the Gambia (top) and Kenya (bottom). To avoid capturing direct effects of the HbS association, correlation values are computed after excluding HbS-carrying individuals. All pairs of biallelic variants with estimated minor allele frequency at least 5% and at least 75% of samples having non-missing and non-mixed genotype call are shown (totalling 16,487 variants in the Gambia and 13,766 variants in Kenya). Colours indicate the subset of comparisons between HbS-associated variants in Pfsa regions relevant for the population (red) and between variants in LD with the CRT K76T mutation. Labelled points denote the variant pairs showing the highest and second-highest pairwise correlation in each population after grouping correlated variants into regions; for this purpose regions were defined to include all nearby pairs of correlated variants with minor allele frequency ≥5% and r2 > 0.05, such that no other such pair of variants within 10 kb of the given region boundaries is present (Methods). A longer list of regions showing increased between-chromosome LD is presented in Supplementary Table 5.
