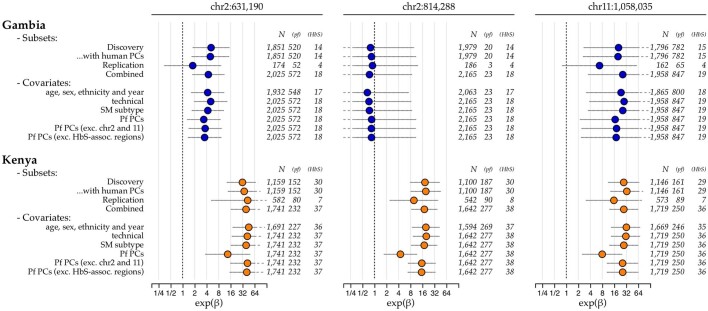
Extended Data Fig. 3. Odds ratios for association of HbS with the Pfsa variants in severe malaria cases.
Plot shows parameter estimates (points) and 95% posterior credible intervals (horizontal line segments) for the association of HbS with Pf genotype at each of the three Pfsa lead variants (columns), using several combinations of sample subsets and covariates (rows) in The Gambia and Kenya. Estimates are computed separately for each SNP using logistic regression with the given covariates included as fixed-effect terms, and are based on directly-typed HbS genotypes assuming a dominance model of HbS on Pf genotype. Samples with mixed Pf genotype calls are excluded from the regression. All estimates are made using a weakly-informative log-F(2,2) prior (Supplementary Methods) on the genetic effect; a diffuse log-F(0.08,0.08) prior is also applied to covariate effects. Row names are as follows: "Discovery": samples with human genome-wide imputed data that were included in our initial scan (Fig. 1); "Replication": the 825 additional samples that are not closely related to discovery samples (as determined previously8); "Combined": all samples with direct typing (as in Fig. 2 and Extended Data Fig. 2); "technical": indicators of sequencing performance including indicator of SWGA or whole DNA sequencing method for the sample, sequence read depth, insert size, and proportion of mixed genotype calls; "SM subtype": indicator of clinical presentation (cerebral malaria, severe malarial anaemia or other severe malaria) the individual was ascertained with; "Pf PCs": principal components (PCs) computed using all called biallelic SNPs having minor allele frequency at least 1% in each population and thinned to exclude variants closer than 1kb; additional rows are shown for PCs computed after excluding SNPs in chromosomes 2 and 11, or from the three regions of association shown in Fig. 1 plus a 25kb margin. Numbers to the right of each estimate show the total regression sample size, the number of samples having the non-reference allele at the given Pf SNP, and the number heterozygous or homozygous for HbS.

