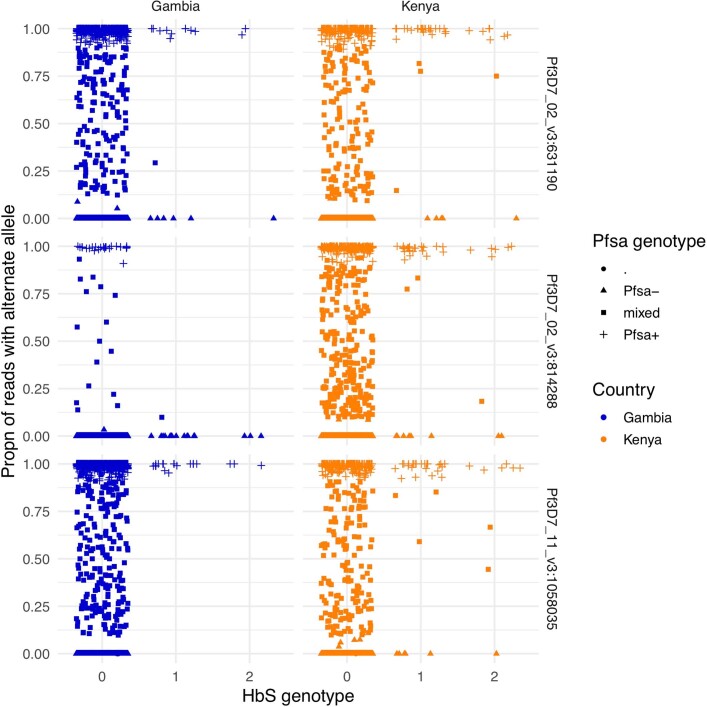
Extended Data Fig. 4. Allele read ratio versus HbS genotype at the three HbS-associated loci.
For each sample (points) and each of the three HbS-associated loci (rows), the figure shows the proportion of sequencing reads that carry the nonreference allele (y axis). Points are separated by country (columns) and HbS genotype (x axis); the x axis values are jittered to visually separate. The called Pf genotype of each sample is indicated by the shape, with mixed calls indicated by squares.

