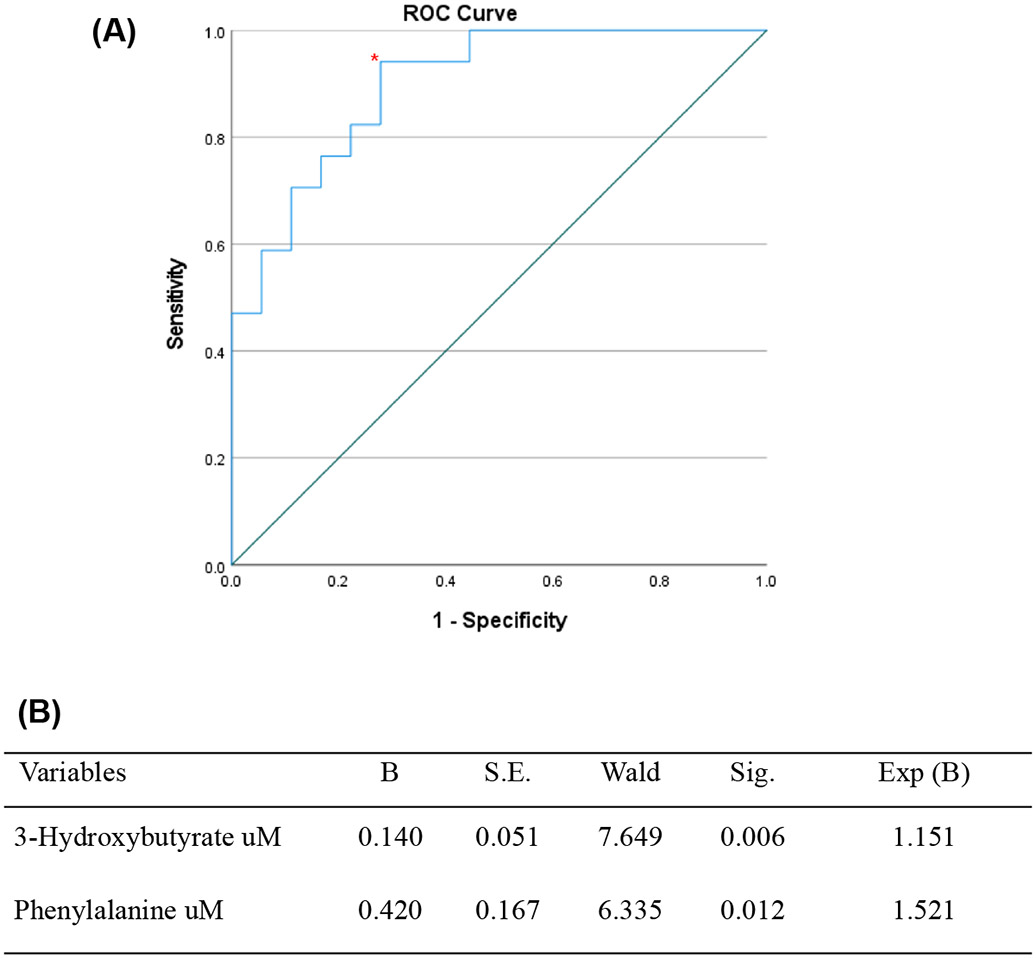
Fig 4.

A) Receiver operating characteristic (ROC) curve for the model probability for responders before treatment based on binary logistic regression. The area under the curve (AUC) was 0.899, the sensitivity of 94% and the specificity of 66% with a p<0.001. The patients with elevated phenylalanine and 3-hydroxybutyrate had 1.5 chances to respond to TCZ. B) Binary logistic regression analysis adjusted by age, anti-CCP positivity and interleukins. The variables considered for the logistic regression analysis were metabolites with p<0.20 in the bivariate model. The model correctly categorized 77.8% of non-responders and 76.5% of responders.
