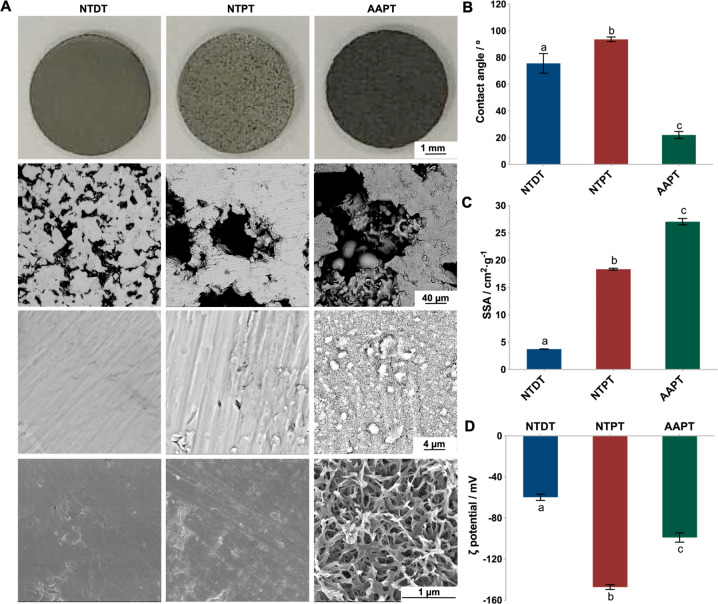
Fig. 1.
Surface characteristics of Ti with or without surface treatment. A The surface topography of NTDT, NTPT and AAPT was observed by SEM, with AAPT showing needle-like submicropores and nanopores (n = 3). B Contact angles were measured by the sessile-drop test (n = 6). C SSAs of samples were determined by the BET method (n = 3). The results showed that AAPT adsorbed more nitrogen than NTPT and NTDT after acid-alkali treatment. D Zeta potentials were measured at pH 7.4 to simulate the situation in vivo (n = 3). Different letters denote significant differences between/among groups (same as below)

