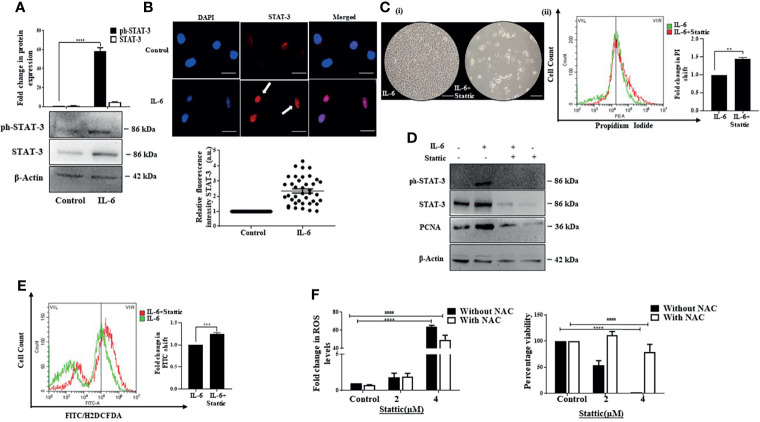
Figure 3.
Stattic generates ROS and abrogates IL-6-induced proliferative effects. (A) Immunoblot showing expression of STAT-3 after 72 h of IL-6 exposure. (B) Immunofluorescence image and relative fluorescence intensity of STAT-3 in untreated and IL-6-treated cells (scale bar: 10 μm). The white arrow denotes STAT-3 protein. (C) (i) Phase-contrast image showing cells after IL-6, or IL-6 plus Stattic treatment post 24 h (scale bar: 100 μm); (ii) graph denoting PI fluorescence after IL-6, or IL-6 plus Stattic (2 μM) treatment post 24 h (D) Immunoblot showing expression of STAT-3 and PCNA in IL-6 and IL-6 plus Stattic (2 μM) treated cells after 24 h of exposure. (E) Graph representing a shift in green fluorescence indicating ROS levels post-Stattic (2 μM) treatment in IL-6 exposed cells after 24 h. (F) Analysis of intracellular ROS levels and corresponding cell viability after 24 h of Stattic exposure. **, *** and **** refers to p value significance of ≤0.01, ≤0.001 & ≤0.0001 respectively. #### represents a comparison between two groups with a significance of ≤0.0001.

