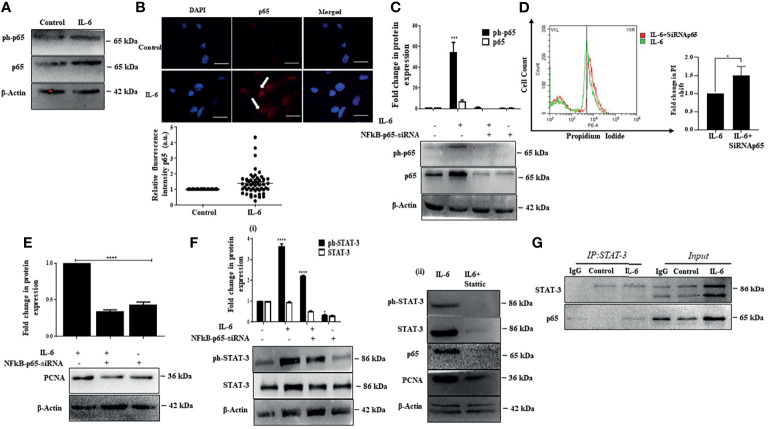
Figure 4.
p65 activation enhances proliferation co-operatively with STAT-3. (A) Immunoblot showing expression of p65 after IL-6 treatment for 72 h. (B) Immunofluorescence image and relative fluorescence intensity of p65 in untreated and IL-6-treated cells (scale bar: 10 μm). The white arrow indicates p65. (C) Immunoblot showing expression of p65 in IL-6-treated or IL-6 plus p65-siRNA treated cells after 72 h of exposure. (D) Graph representing a shift in PI fluorescence in IL-6-treated or IL-6 plus p65-siRNA treated cells after 72 h. (E) Immunoblot showing expression of PCNA in IL-6-treated or IL-6 plus p65-siRNA treated cells after 72 h of treatment. (F) (i) Immunoblot showing expression of STAT-3 in IL-6-treated or IL-6 plus p65-siRNA treated cells after 72 h (ii) Immunoblot showing expression of STAT-3, p65, and PCNA in IL-6-treated or IL-6 plus Stattic exposed cells. (G) Co-immunoprecipitation analysis of STAT-3 with p65 after IL-6 exposure for 72 h The proteins were immunoprecipitated with anti-STAT-3 antibody and then probed with p65. *, *** and **** refers to p value significance of ≤0.1, ≤0.001 & ≤ 0.0001 respectively.

