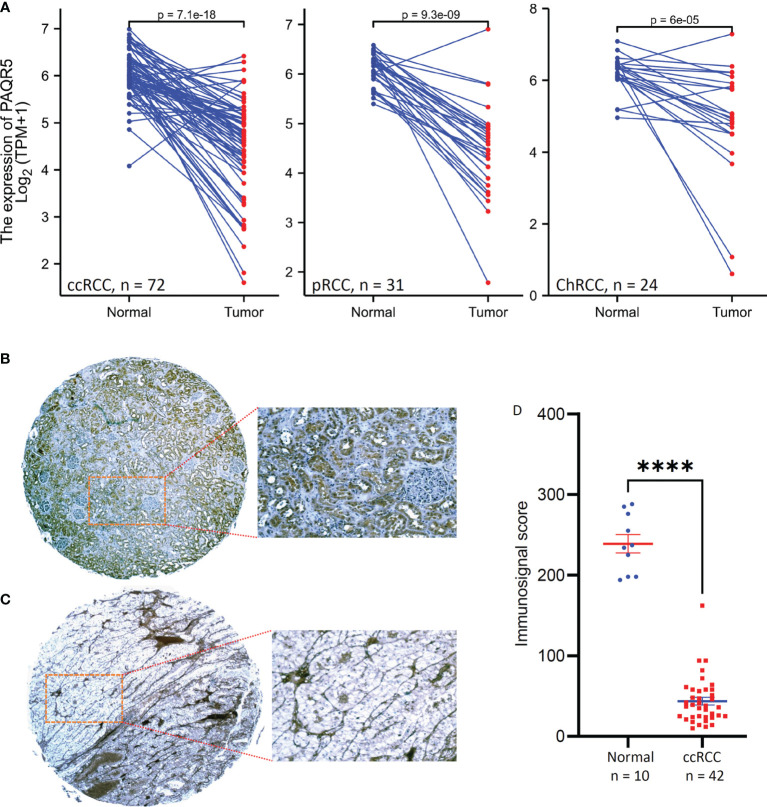
Figure 1.
PAQR5 expression in RCC tissues. (A) Pair-wise comparison was conducted using the RNA-seq datasets from the TCGA project. The p-values were derived from Wilcoxon signed-rank test. (B, C) Representative microscopic images were taken from anti-PAQR5 immunohistochemistry on the normal kidney (B) and ccRCC tissue (C) sections. Magnification x 200. (D) Semi-quantitative data from immunohistochemistry staining were compared between normal kidney and ccRCC tissues. The error bars indicate the MEAN and SEM. The Quadro asterisk indicates a significant difference (Student t-test, p < 0.0001).

