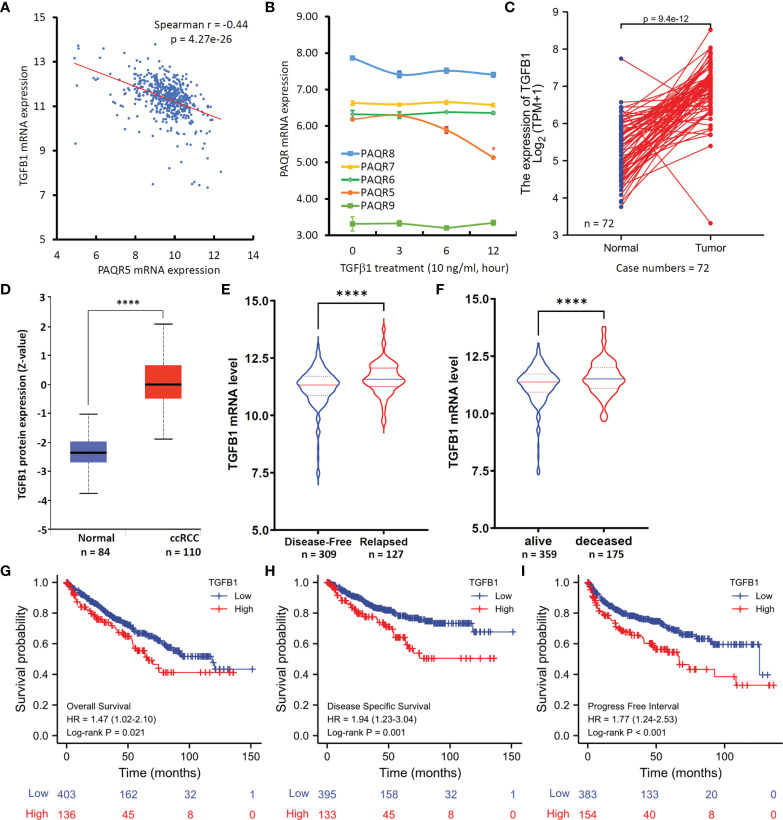
Figure 5.
TGFB1 expression inversely correlates with PAQR5 expression in ccRCC tissues. (A) Spearman coefficient analysis was conducted using the TCGA-Firehose Legacy RNAseq dataset downloaded from the cBioportal platform (case number = 534). The mRNA levels were presented as log2(RSEM+1) values. RSEM: RNA-Seq by Expectation-Maximization. (B) Human IOSE cells were treated with TGFβ1 (10 ng/ml) for the indicated time-period. Total RNAs were extracted for gene expression analysis on the Affymetrix Human Genome U133A plus 2.0 GeneChip. The error bar represents the SEM of the mean. The asterisk indicates a significant difference compared to the 0-h control (Student t-test, p < 0.05). (C) TGFB1 expression levels between case-match pairs of normal kidneys and ccRCC tissues in the TCGA dataset. The p-value was derived from Wilcoxon signed-rank test. (D) TGFβ1 protein level in ccRCC and normal kidney tissues using the CPTAC dataset (22). The Quadro-asterisk indicates a significant difference (unpaired t-test, p < 0.0001). (E, F) TGFB1 expression levels were compared between disease-free vs. relapsed or alive vs. deceased patients using the TCGA-Firehose Legacy RNAseq dataset downloaded from the cBioportal platform. The Quadro-asterisk indicates a significant difference (unpaired t-test, p < 0.0001). (G–I) Kaplan-Meier curve analysis was conducted for overall and disease-specific survival, as well as the progression-free interval in ccRCC patients based on TGFB1 expression using the TCGA dataset with a minimum p-value approach (26).

