FIGURE 2.

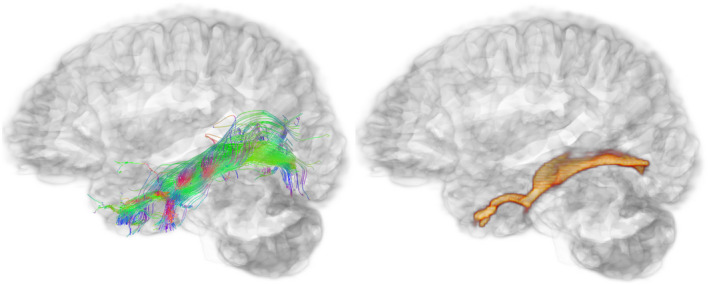
Pathway‐specific tract vs. eigenmode images. View from the left side of the brain showing the left inferior longitudinal fasciculus tractography output (left) and corresponding eigenmode image (right)

Pathway‐specific tract vs. eigenmode images. View from the left side of the brain showing the left inferior longitudinal fasciculus tractography output (left) and corresponding eigenmode image (right)