. 2021 Nov 2;28(3):452–460. doi: 10.1158/1078-0432.CCR-21-2225

Figure 2.

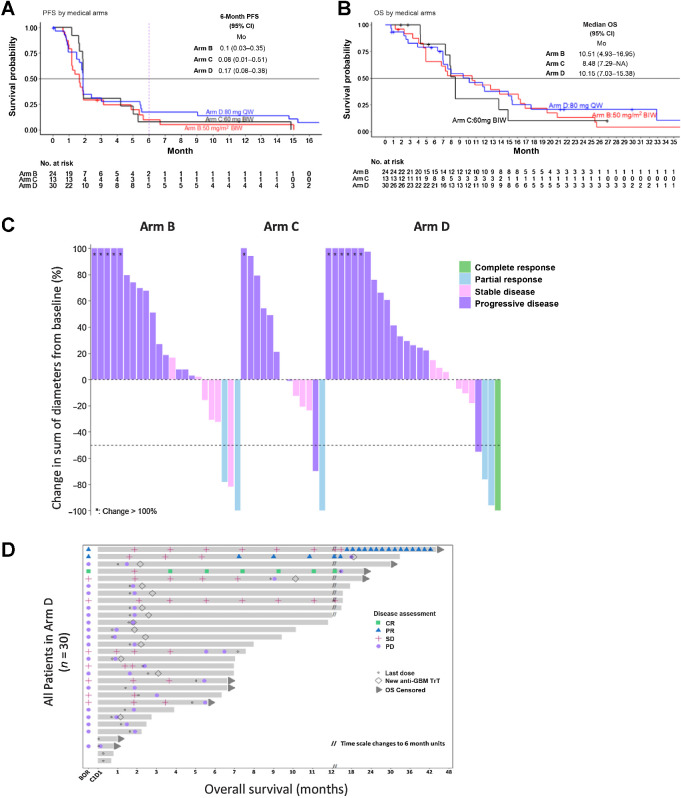
Figure 2. Efficacy and survival of selinexor treatment in the mITT population. Disease-free survival (A) and OS (B) in the mITT population, stratified by trial arm (excluding one patient from Arm C who did not undergo efficacy evaluation). C, Waterfall plot shows the maximal reduction (or increase) for 63 patients treated in Arms B (n = 23), C (n = 13), and D (n = 27), calculated as the change from baseline in sum of the products of the perpendicular diameters of the tumor, as determined by the local investigators using the response assessment for neuro-oncology criteria. D, Swimmer plot of patients enrolled in Arm D. BIW, twice weekly; QW, once weekly.

Efficacy and survival of selinexor treatment in the mITT population. Disease-free survival (A) and OS (B) in the mITT population, stratified by trial arm (excluding one patient from Arm C who did not undergo efficacy evaluation). C, Waterfall plot shows the maximal reduction (or increase) for 63 patients treated in Arms B (n = 23), C (n = 13), and D (n = 27), calculated as the change from baseline in sum of the products of the perpendicular diameters of the tumor, as determined by the local investigators using the response assessment for neuro-oncology criteria. D, Swimmer plot of patients enrolled in Arm D. BIW, twice weekly; QW, once weekly.