
Figure 4d.
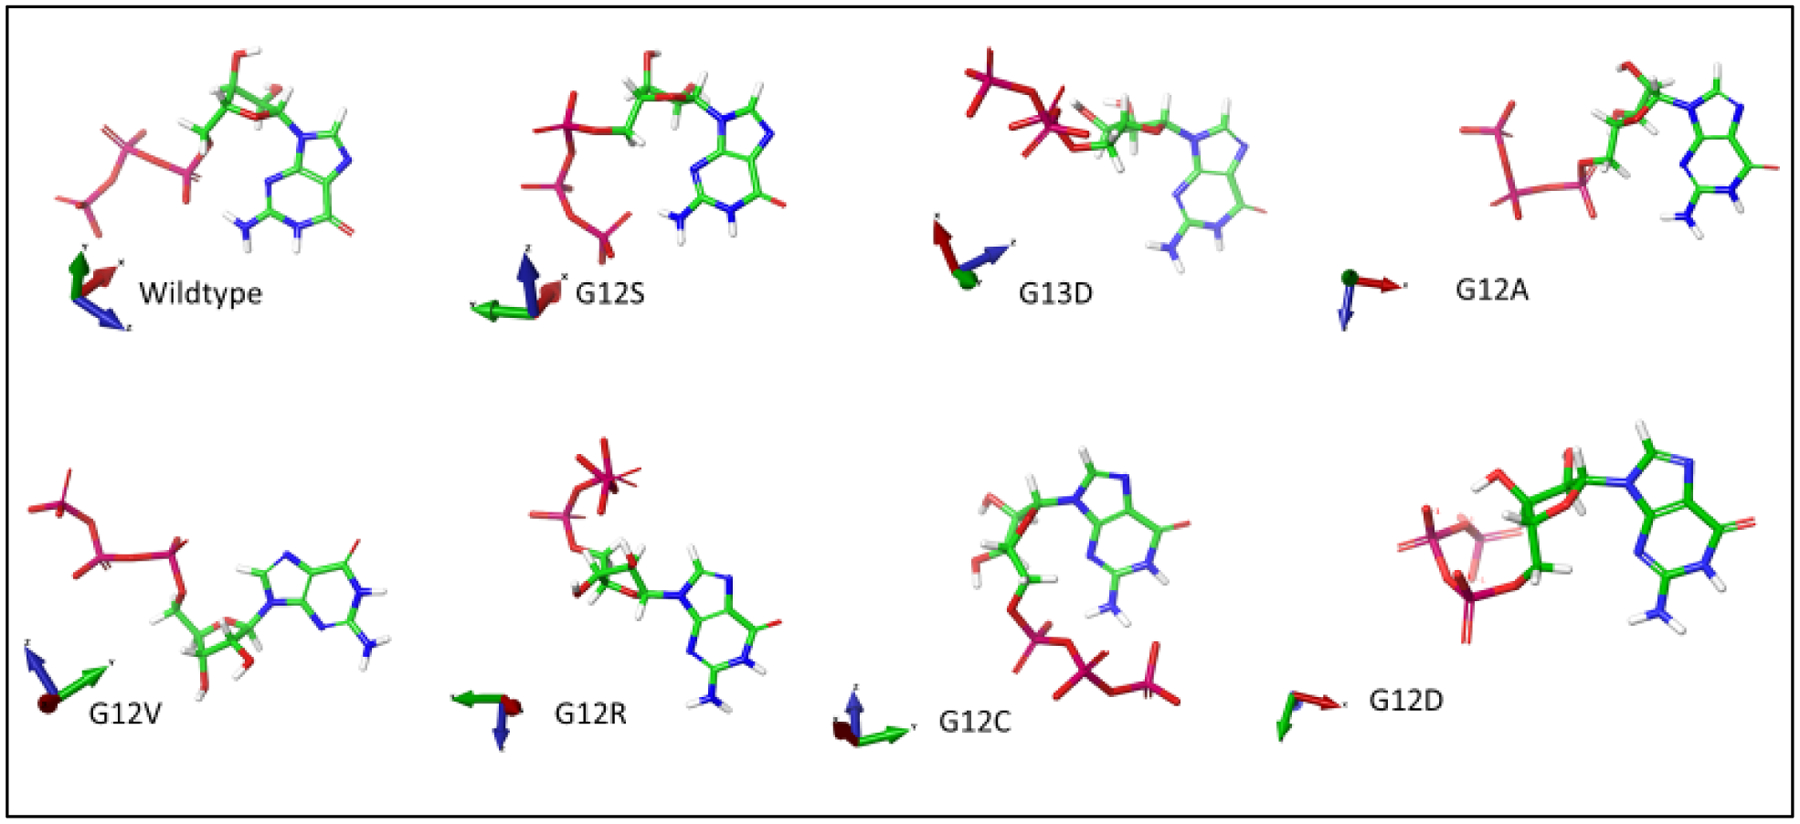
GTP Conformation Respective to its Protein Binding. XYZ coordinates are displayed on the left of each respective GTP molecule. GTP conformational changes when bound to KRAS protein. GTP molecule structures were taken post docking of their respective protein binding, and their conformational structures were compared with correlated XYZ coordinates, and using the pyrimidine rings as a point of reference.