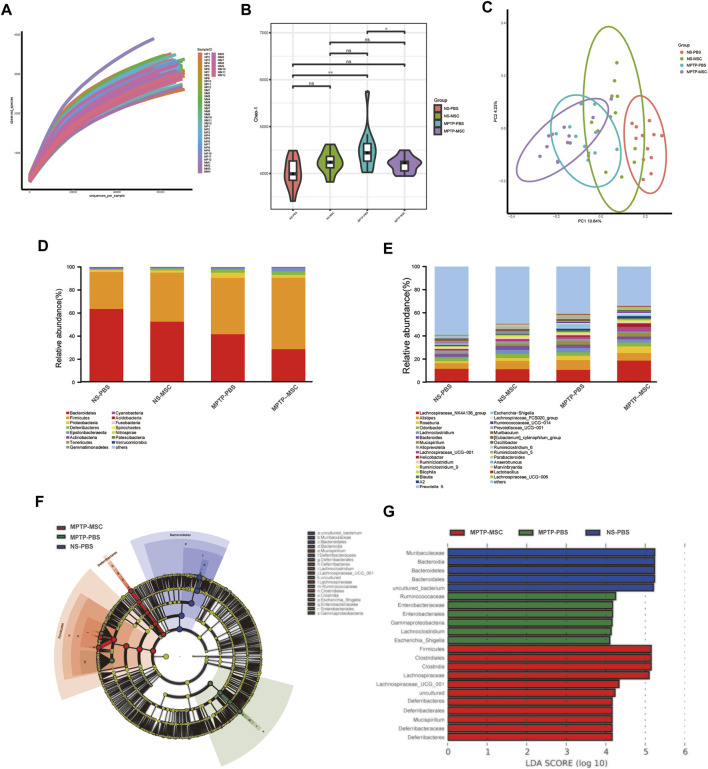
FIGURE 4.
UC-MSCs modulated the composition of gut microbiota in MPTP-induced PD mice. (A) Rarefaction curves of samples; (B) alpha diversity presented by Chao-1 index; (C) PCoA analysis of samples; (D) histogram based on relative abundance at phylum level; (E) average relative abundance of the microbial community for each group at the genus level. (F,G) Comparison of gut microbiota using LES among the NS-PBS, NS-MSC, MPTP-PBS, and MPTP-MSC groups at the OUT level. Cladogram (F) and histogram (G) of bacterial taxa that significantly differed among the three groups (LDA >4.0 and p < 0.05). Blue, green, red, or shading in the cladogram depicts bacterial taxa that were significantly higher in the NS-PBS, MPTP-PBS, or MPTP-MSC groups, n = 12 per group. *p < 0.05, **p < 0.01 compared with the MPTP-PBS group.

