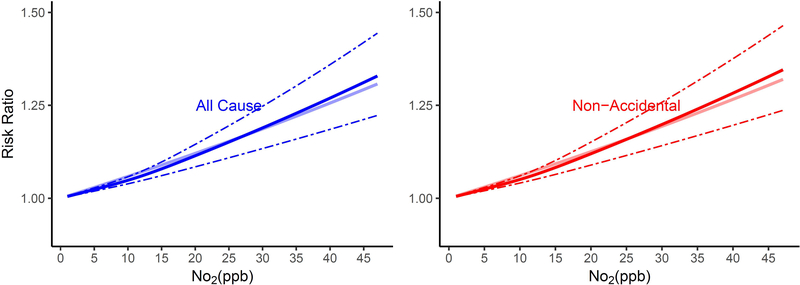
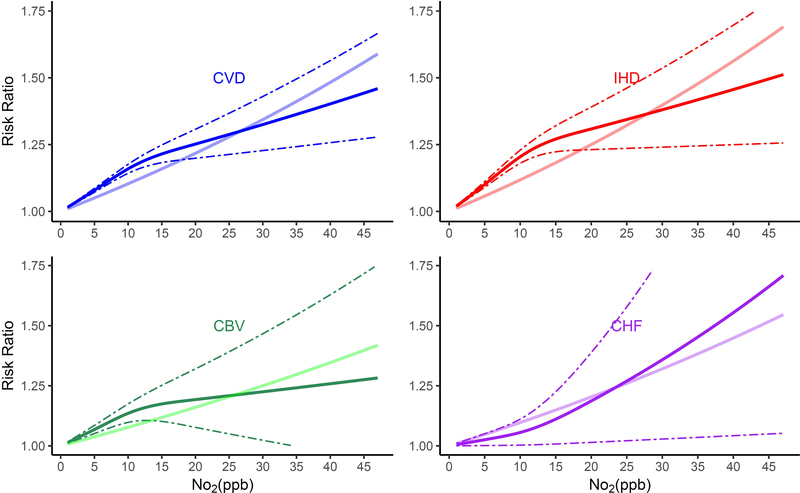
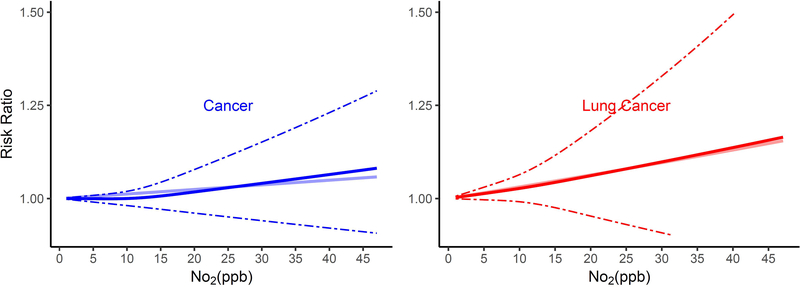
Figure 1.
Non-linear Relationship of Mortality Hazard Ratio (95% CI) for Cause-Specific Mortality and 10 ppb Increase in 12-month Moving Average NO2. All analyses were conducted using Cox Proportional Hazard models with strata for sex (male, female), race (White, non-White), age (1 year age categories with 90+ years old as one category), and ZIP code, and including ZIP code- and state-level SES as model covariates. Models were also adjusted for 12-month moving average PM2.5 using a 2-stage approach. The bold solid line represents the non-linear relationship estimated using restricted cubic spline (3 knots); the dotted line represents the 95% C.I.s for the non-linear association, and the muted solid line represents the linear association for (A) All-cause and non-accidental mortality, (B) Cardiovascular-related mortality, (C) Respiratory-related mortality, (D) Cancer and lung cancer mortality


