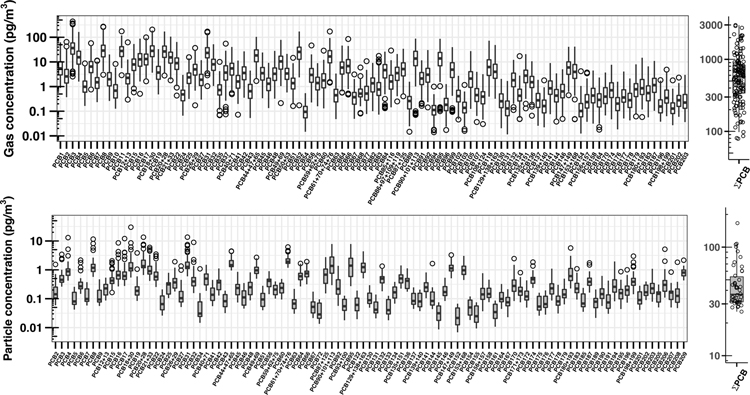
Figure 1.
Summary of individual congener and ΣPCB concentrations in gas and particle phases. Top panels represent gas-phase (n = 141, 103 congeners) and bottom panels represent particle-phase (n = 46, 101 congeners) from 2009 samples in Chicago. The box plots include the maximum, 75th percentile, median, 25th percentile and the minimum value. Please note the difference in the x-axes scale for the individual PCB congeners plots and y-axis scale.

