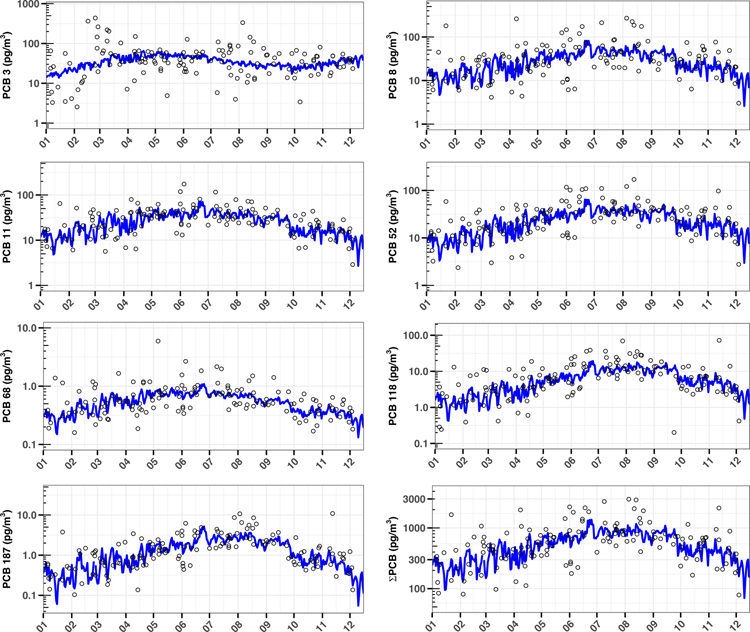
Figure 3.
Time series of selected congeners and ΣPCB for Chicago. Void circles are observations (n = 141) and blue line represents LME model (Eq. 1). LMER predictions were calculated using daily meteorological data. The x-axis represents the months of the year. Please note the difference in the y-axis scale.

