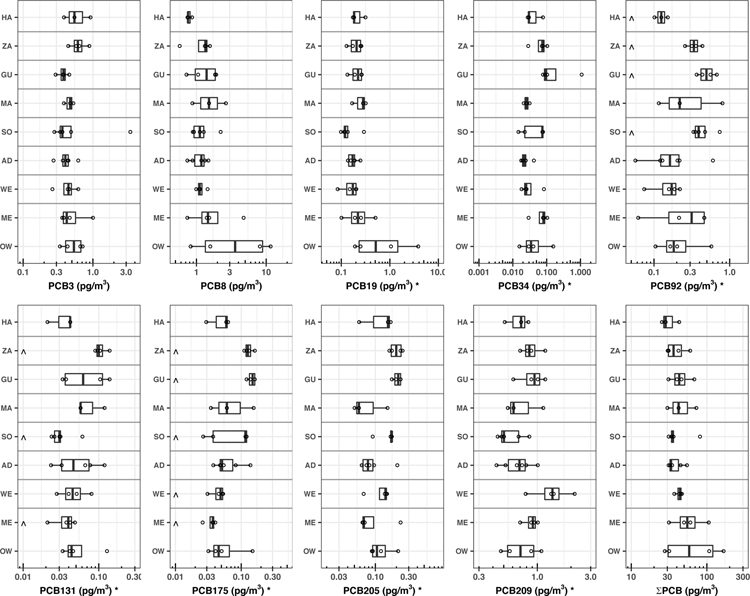
Figure 6.
Site-specific concentrations of selected PCB congeners and ƩPCB (n = 37) in particle-phase. Grey horizontal lines separate clusters of sites of less than 2.5 km of distance, roughly from north to south. Sites with three or more samples were included. Asterisks (*) indicate significant differences in log10 concentration among locations (Anova, p < 0.05). Further, carets (^) in PCB plots indicate a significant difference between locations (Tukey test, p < 0.05, See text). The box plots include the maximum, 75th percentile, median, 25th percentile and the minimum value. Please note the difference in the x-axis scale.

