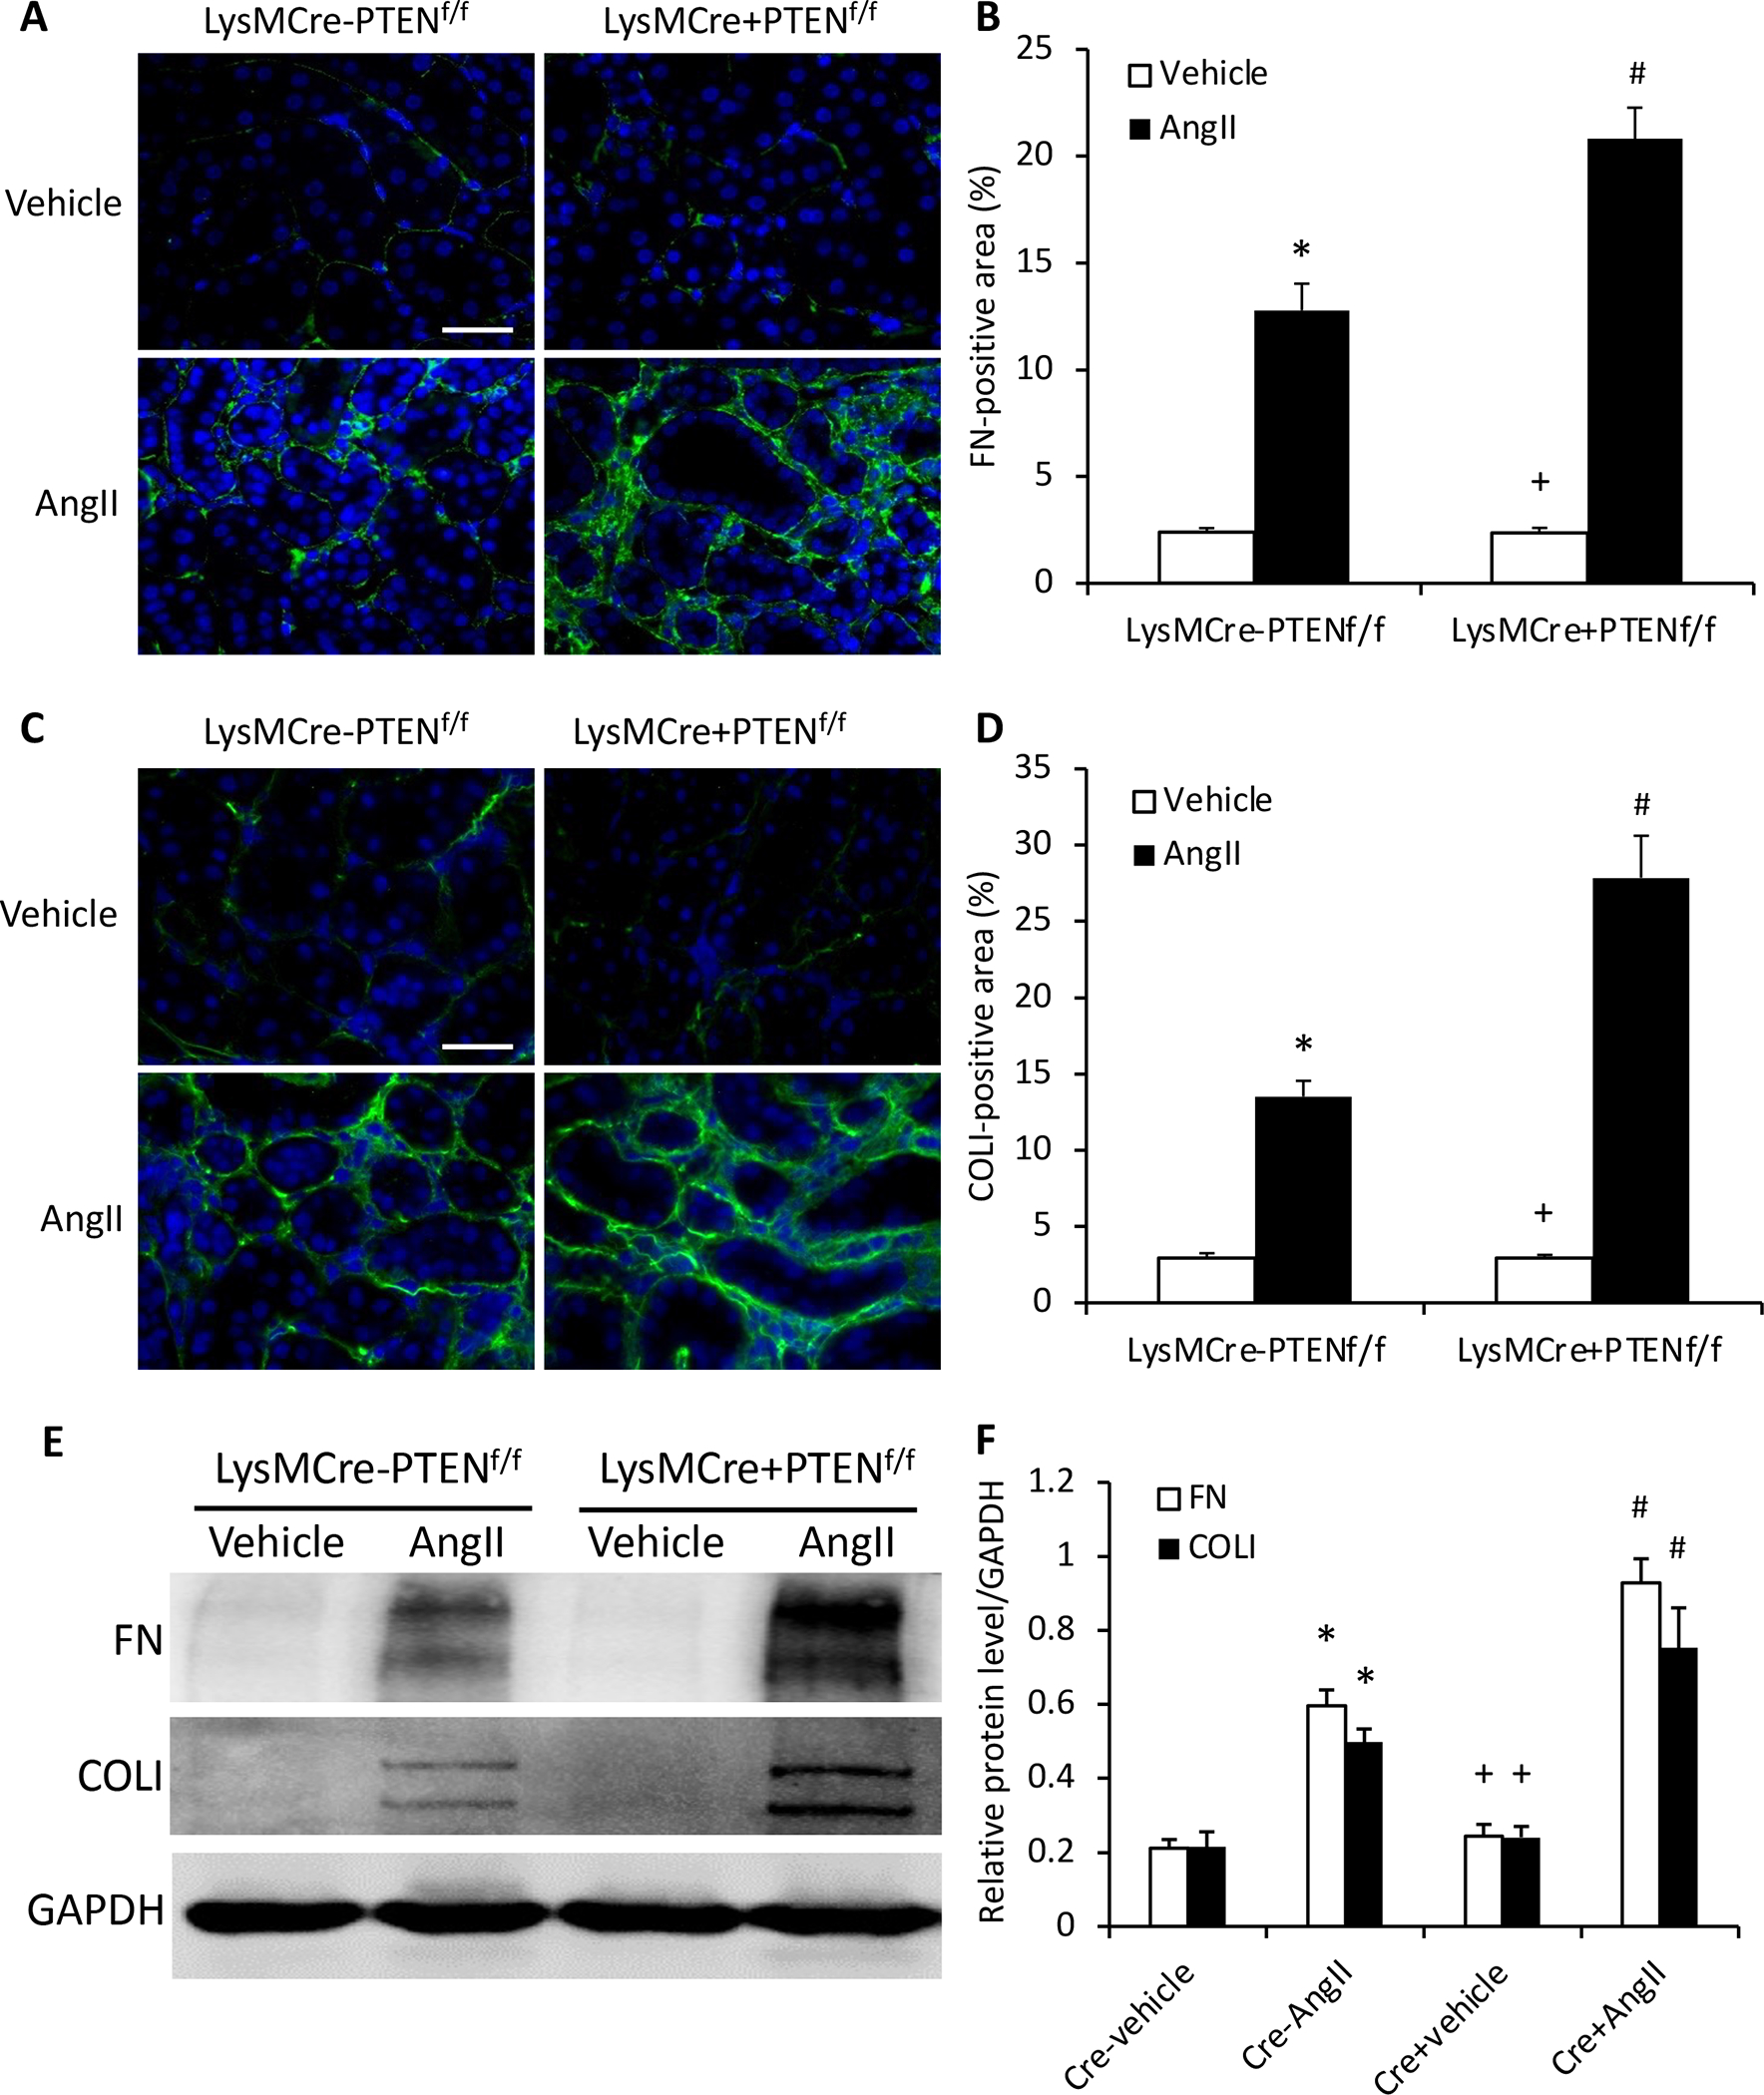
Figure 3. Myeloid PTEN deficiency increases fibronectin and collagen I expression.

A, Representative photomicrographs of immunofluorescence staining for fibronectin (FN; green) in the kidney. Scale bar, 20 μm. B, Quantitative analysis of fibronectin (FN; green)-positive area in the kidney. *P<0.01 vs LysMCre−PTENf//f-Vehicle; +P<0.01 vs LysMCre+PTENf//f-AngII; and #P<0.01 vs LysMCre−PTENf//f-AngII. n=6 per group. C, Representative photomicrographs of immunofluorescence staining for collagen I (Col I; green) in the kidney. Scale bar, 20 μm. D, Quantitative analysis of Col I positive area in the kidney. *P<0.01 vs PTENf//f-Vehicle; +P<0.01 vs LysMCre+PTENf//f-AngII; and #P<0.01 vs LysMCre−PTENf//f-Ang II. n=6 per group. E, Representative Western blots of protein expression of FN and Col I in the kidney. F, Quantitative analysis of FN and Col I protein expression levels in the kidney. *P<0.01 vs LysMCre−PTENf//f-Vehicle; +P<0.05 vs LysMCre+PTENf//f-AngII; and #P<0.01 vs LysMCre−PTENf//f-AngII. n=6 per group.
