
Extended Data Fig. 4. Cyro-EM image processing for GudB6-GltA6B6.
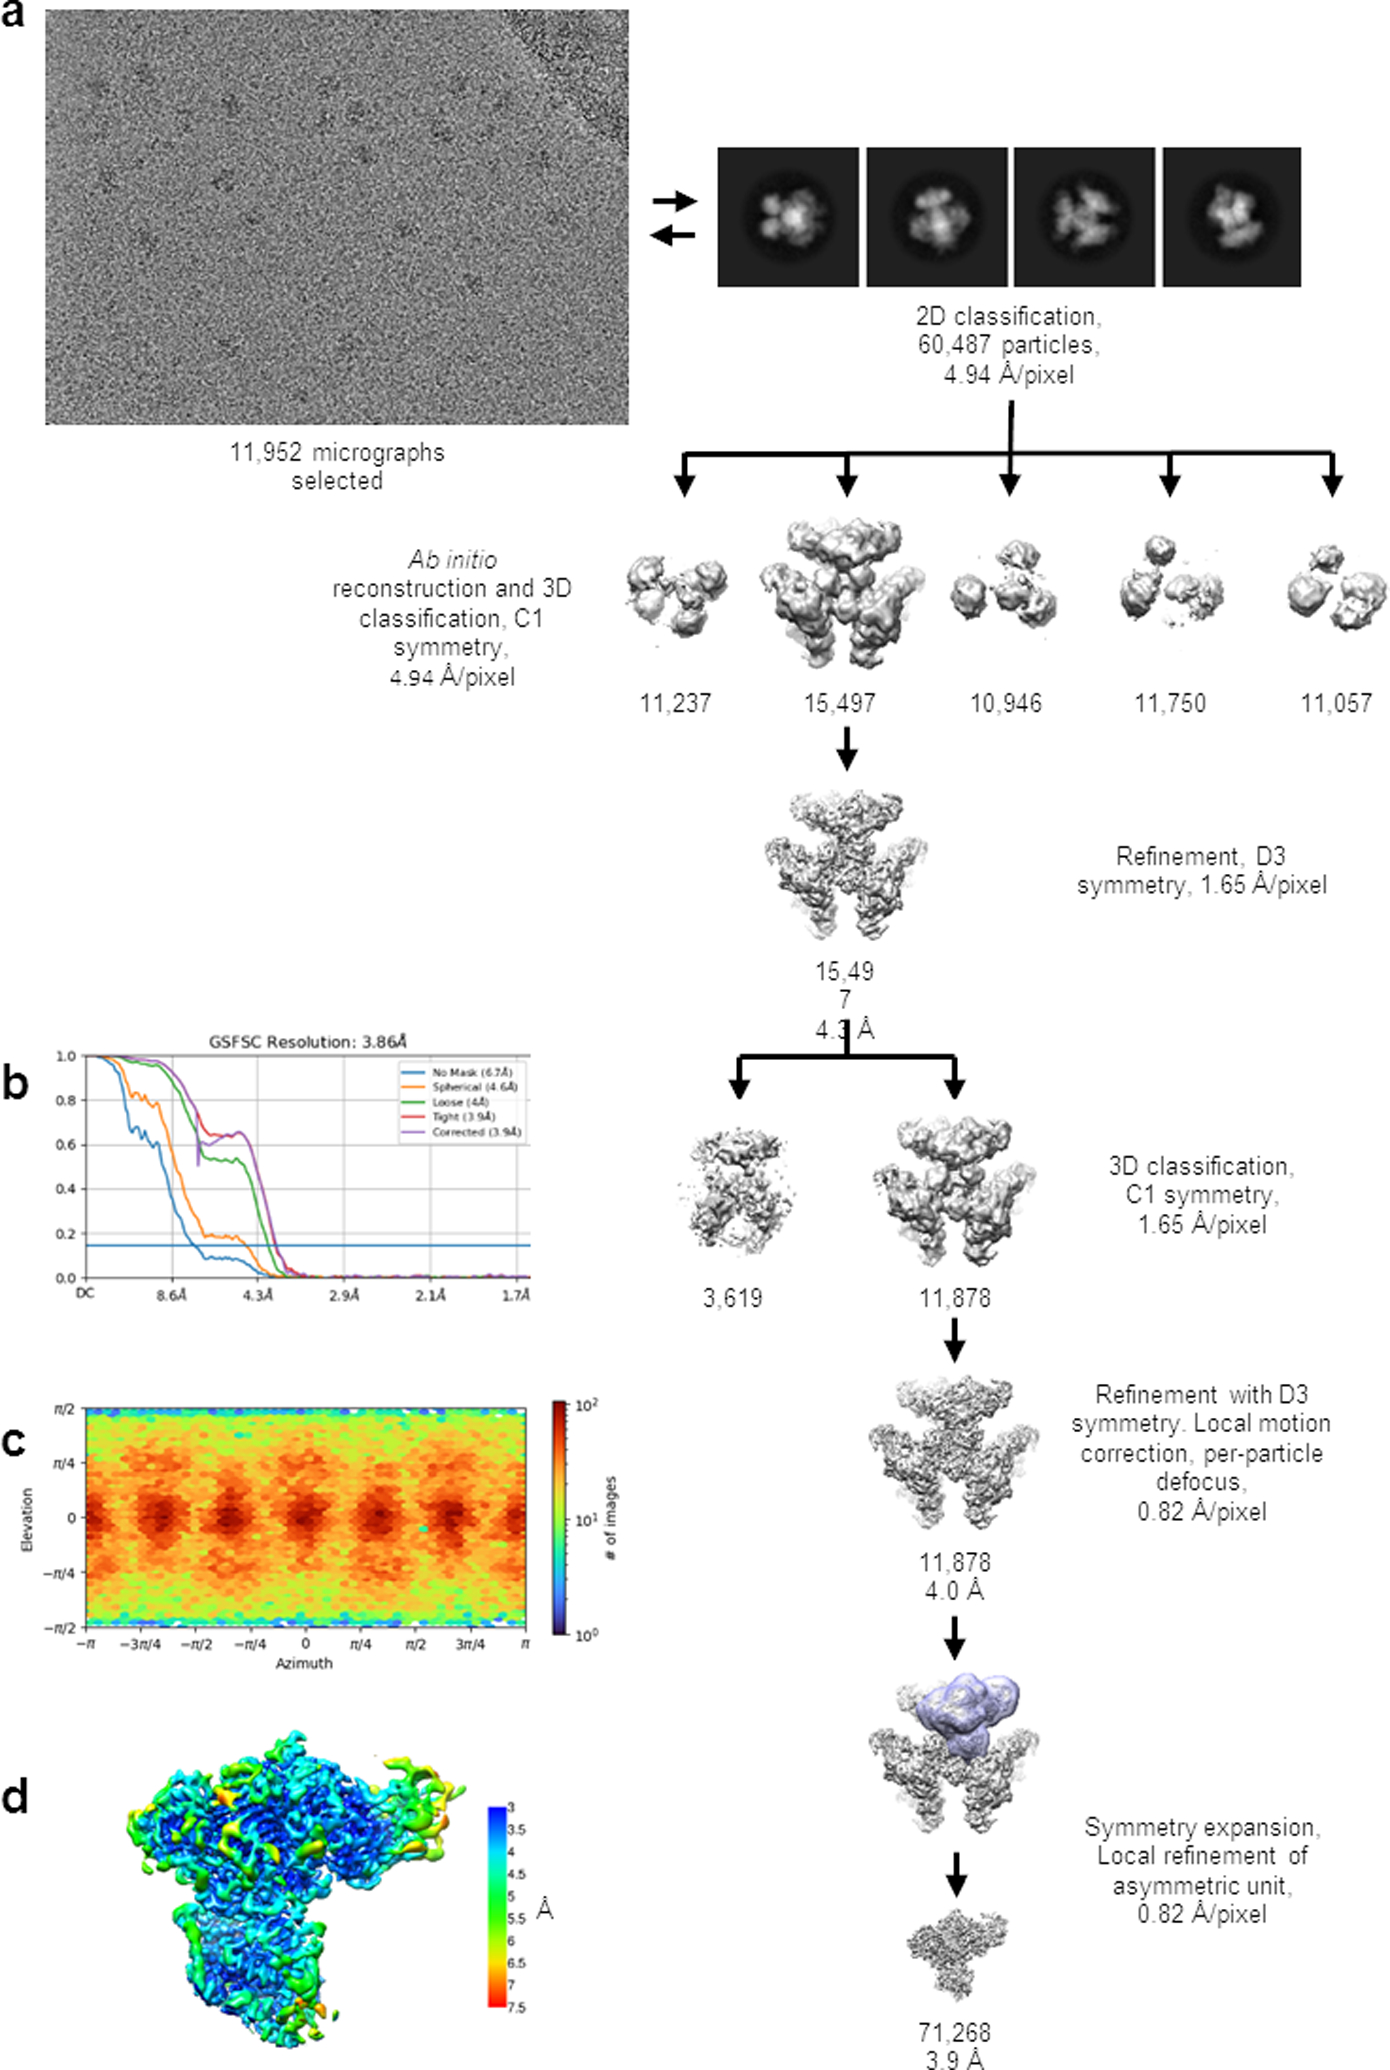
(a) Scheme for single particle cryo-EM analysis of the GudB6-GltA6B6. Details of the process are described in the Methods section. Briefly, particles were iteratively picked from selected micrographs using well resolved 2D class averages, followed by Ab initio 3D reconstruction and classification into five classes. The best resolved 3D class was refined with D3 symmetry imposed. In order to account for deviations from D3 symmetry, further refinement focused on single GudB-GltAB asymmetric units. The number of particles that are included in the maps are indicated, along with the estimated resolution where relevant.
(b) FSC curves for the refined GudB-GltAB asymmetric map.
(c) Angular distribution plot.
(d) 3D map colored according to local resolution estimate.