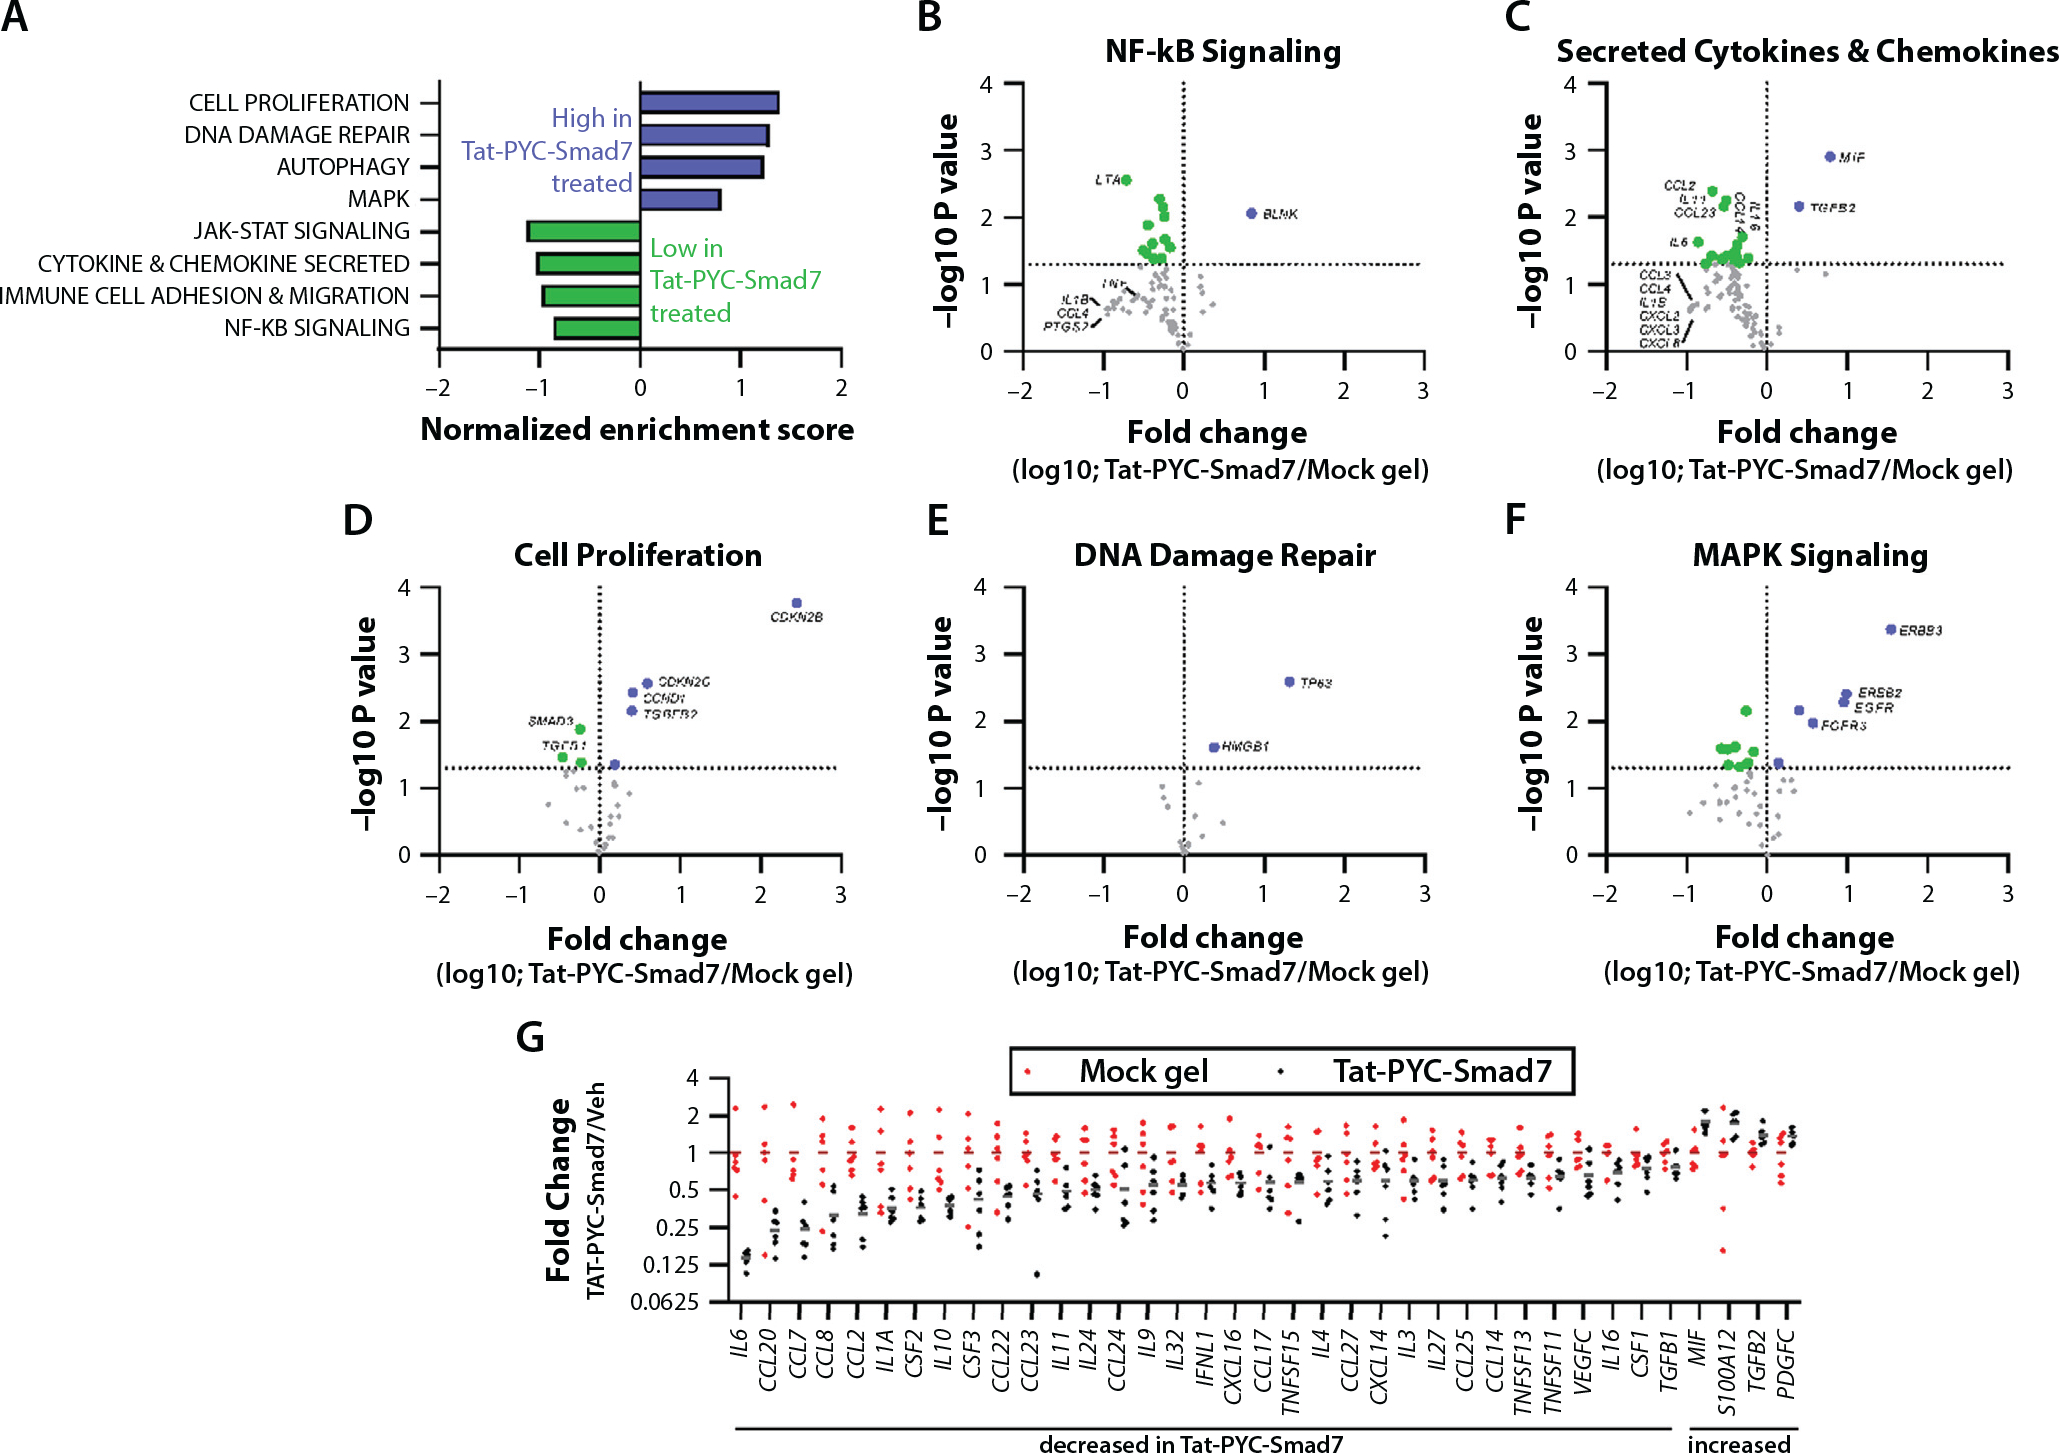
Fig. 4.

Genes and functional pathways altered in Tat-PYC-Smad7 treated samples. RNA harvested from formalin fixed, paraffin embedded biopsy samples (6 vehicle treated samples versus 6 Tat-PYC-Smad7 treated samples) was subjected to NanoString nCounter Canine IO panel analysis. (A) Relative gene expression in 28 functional categories was analyzed by gene set enrichment analysis. Categories enriched in Tat-PYC-Smad7 treated samples versus vehicle treated samples as determined by normalized enrichment scores are presented. (B-F) Volcano plots presenting the log10 transformed fold change (on the x axis) and the −log10 transformed P value (on the y axis) of individual genes comparing Tat-PYC-Smad7 to vehicle in 5 functional categories, with individual genes highlighted. Genes to the left of the vertical line (green) are decreased in Tat-PYC-Smad7 treated samples, and genes to the right of the vertical line (blue) are increased in Tat-PYC-Smad7 treated samples. The horizontal line indicates P = .05, and points above this line represent differences with P < .05. (G) The relative expression of all secreted chemokines and cytokines in each sample with a significant difference between vehicle and Tat-PYC-SMAD7 treatments (P < .05 as determined by 2-tailed Student t test) are presented.
