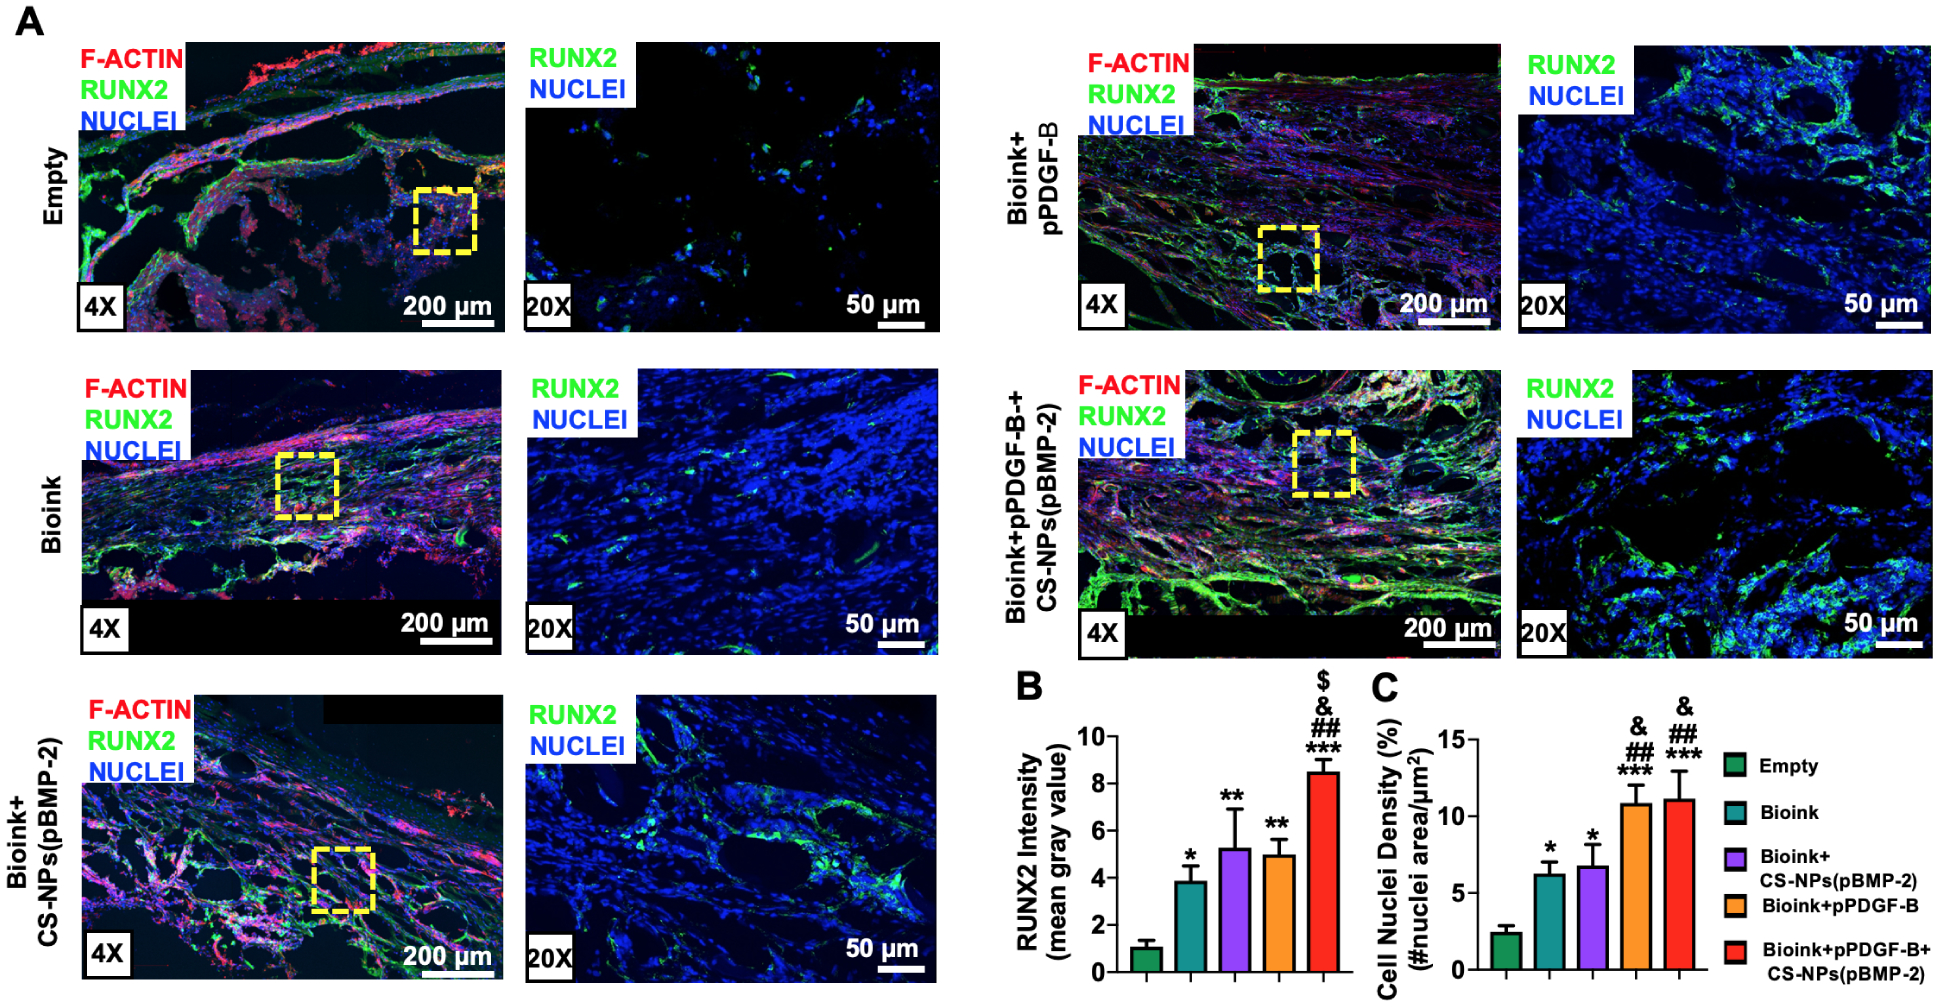
Fig 8.

(A) IHC staining of sectioned calvarial defects at Week 6 stained with nuclei (blue), F-actin (red) and RUNX2 (green). (B) RUNX2 Fluorescence intensity determined based on mean gray value from RUNX2 stained images at Week 6. (C) Cell nuclei density (%) determined from nuclei-stained fluorescence images at Week 6. Data were presented as mean ± s.e.m (n=5). (*: compared to the empty group, p*<0.05, p**<0.01, p***<0.001). (#: compared to bioink group, p#<0.05, p##<0.01, p###<0.001). (&: compared to the bioink+CS-NPs(pBMP-2 group), p&<0.05, p&&<0.01, p&&&<0.001). ($: compared to the bioink+pPDGF-B group, p$<0.05, p$ $<0.01, p$ $ $<0.001).
