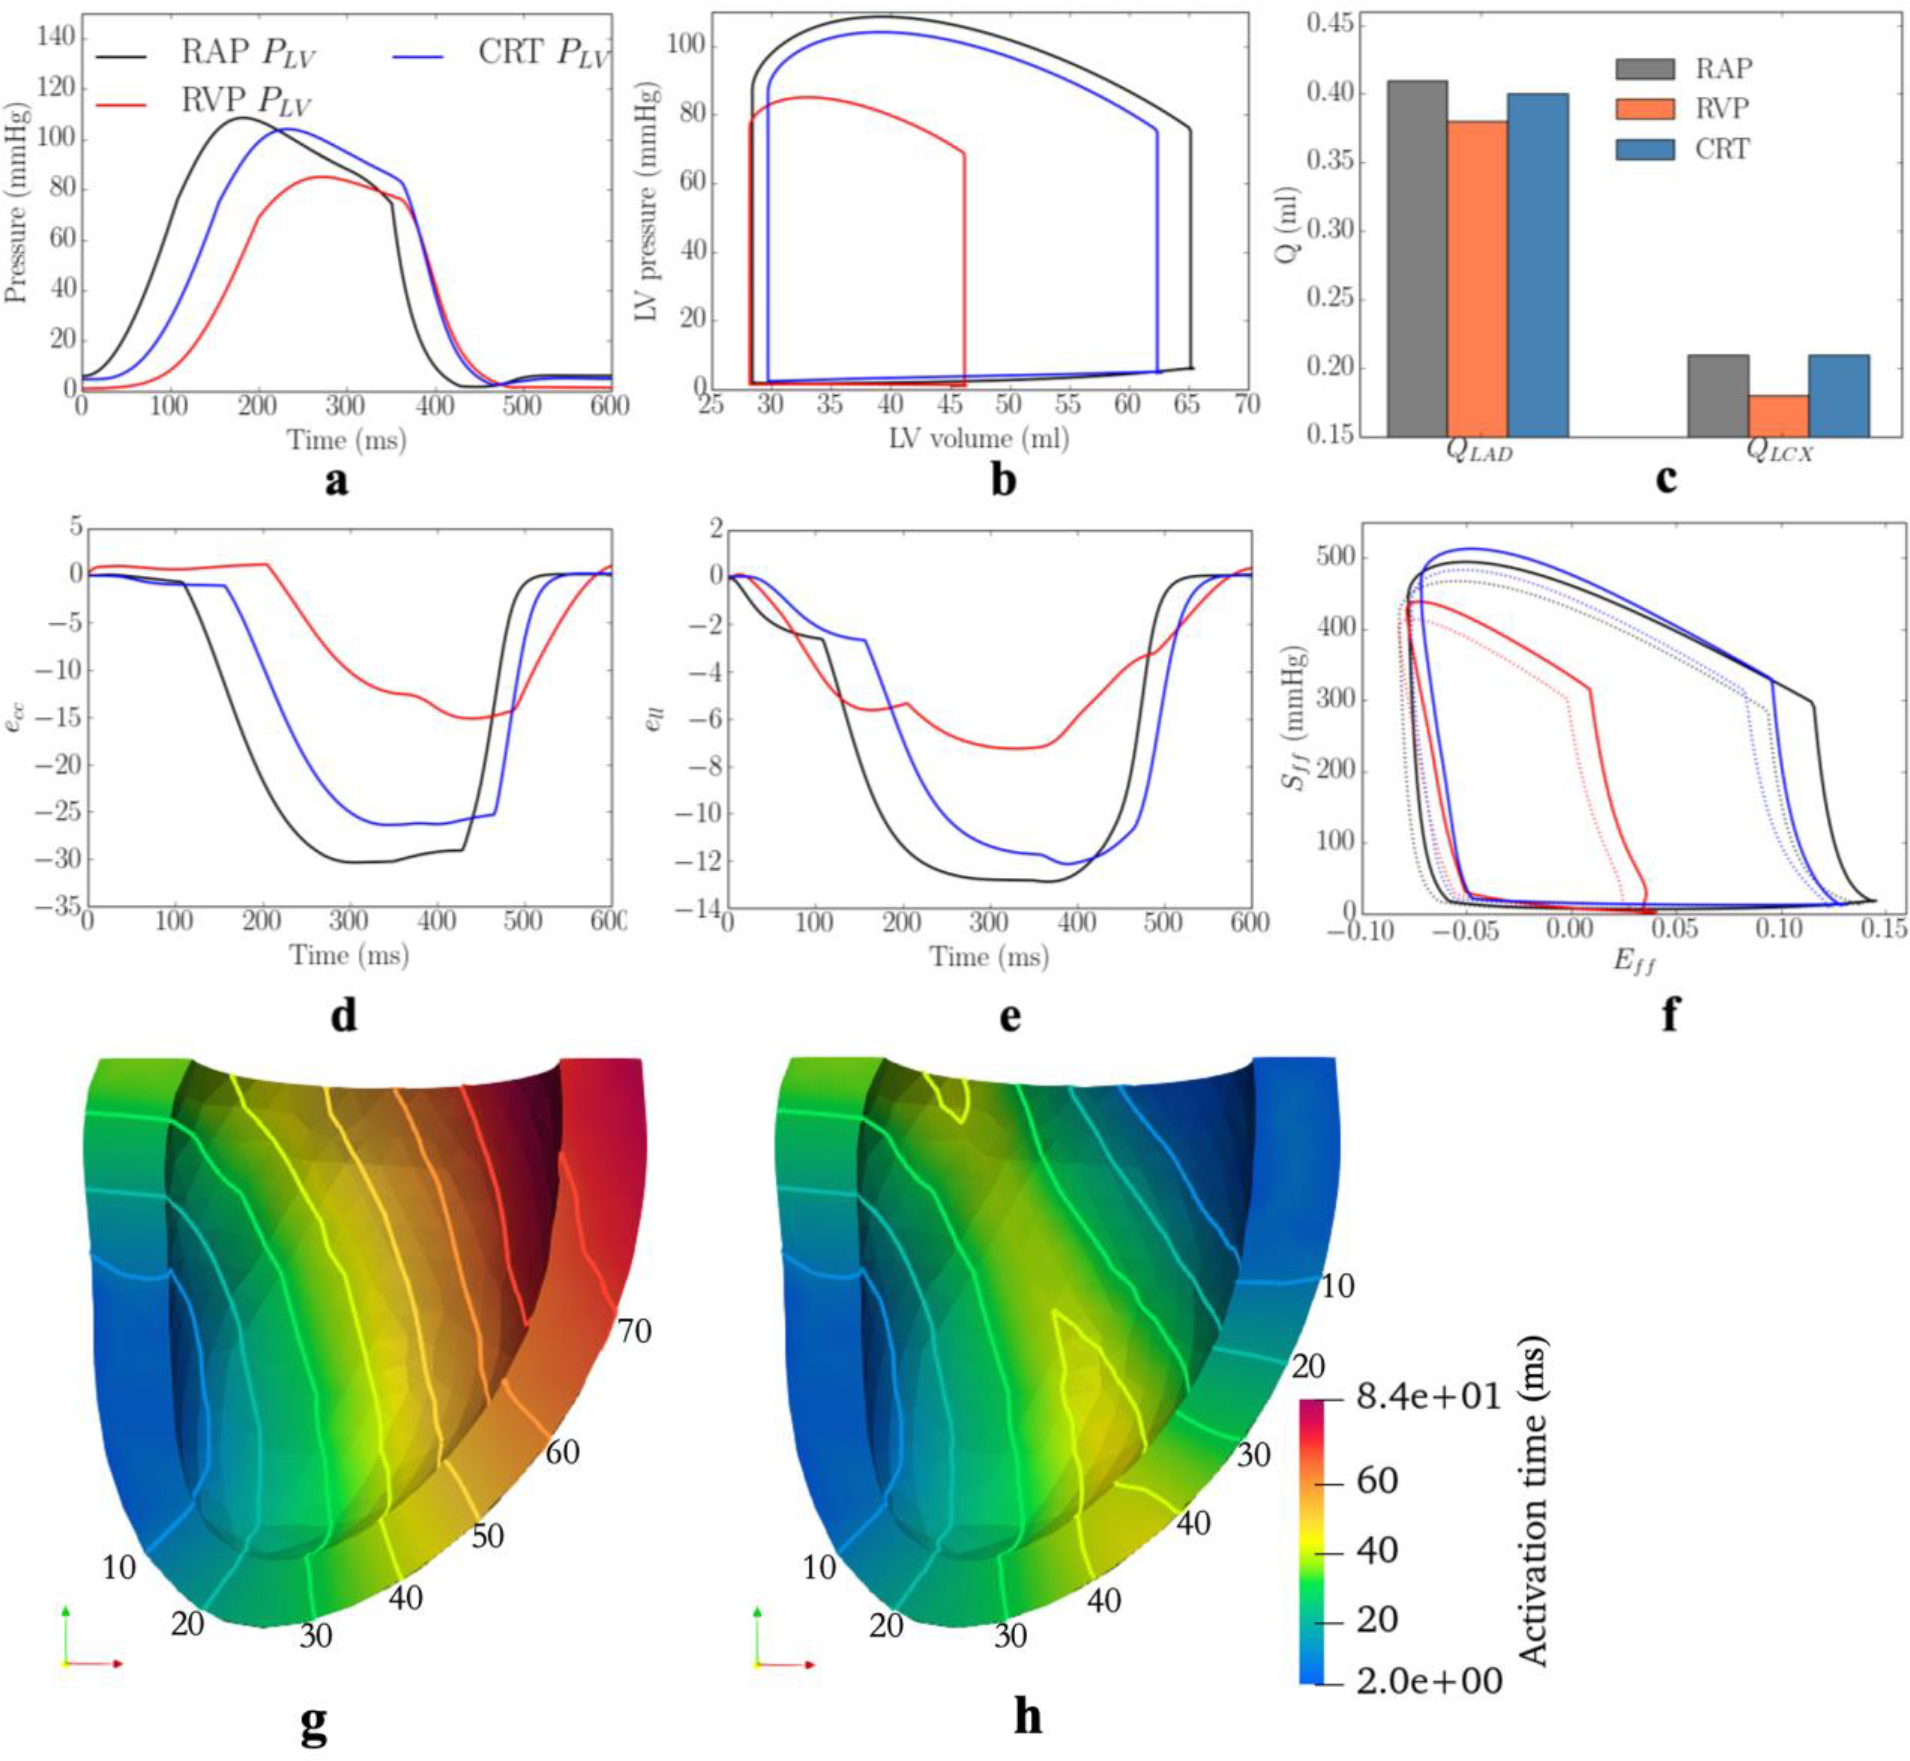
Figure 4:

Comparison of the model predicted waveforms in terms of a. LV pressure; b. PV loop; c. total coronary flow rates in the d. ecc; e. ell; and f. Sff-Eff loop in baseline, MD, and CRT cases associated with 1 swine model. Activation pattern of the LV in g. MD; h. CRT cases. Solid lines denote isochronal lines in the activation patterns. Refer to Figure D3 for the other swine model
