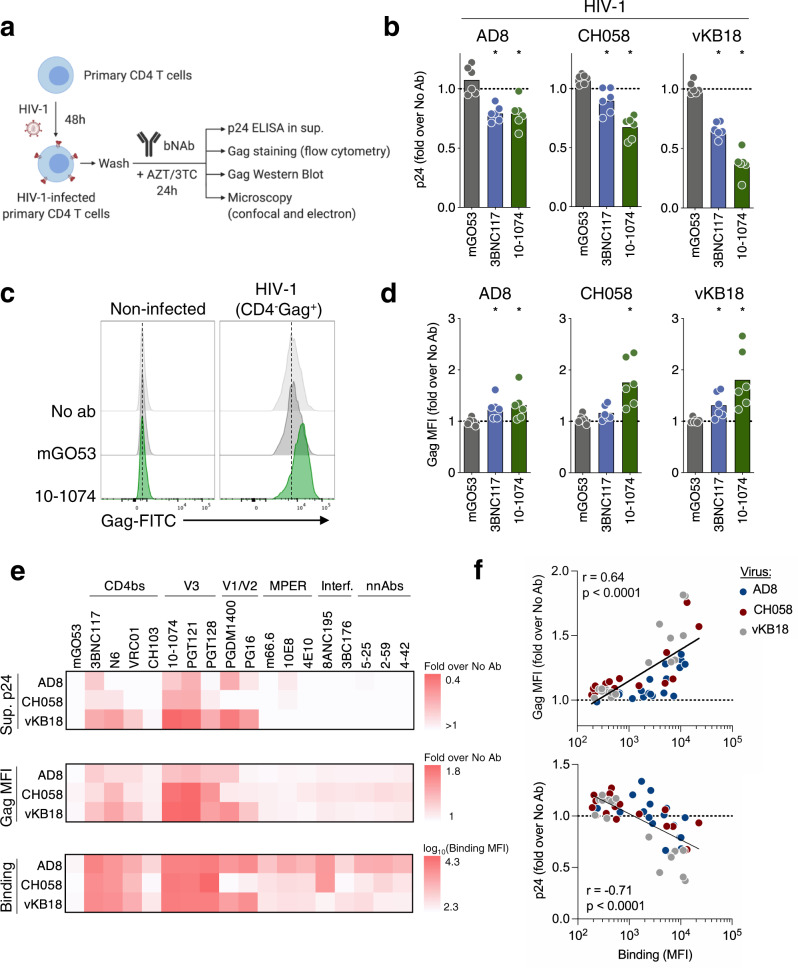
Fig. 1. bNAbs inhibit HIV-1 release.
a Schematic of the experimental strategy. Primary CD4 T cells were infected with HIV-1 for 48 h, washed, and cultivated for 24 h with antibodies (anti-HIV-1 Env or isotype control; 100 nM, corresponding to 15 μg/mL) in the presence of azidothymidine (AZT) and lamivudine (3TC) prior to subsequent analyses. b p24 levels in the supernatants of CD4 T cells infected with three strains of HIV-1 (AD8, CH058 or vKB18) and cultivated for 24 h with an isotype control (mGO53) or bNAbs (3BNC117 and 10–1074). p24 concentrations were measured by ELISA and normalized to the “no antibody” condition. Each dot represents a donor of CD4 T cells (n = 6). *p = 0.0313 (two-tailed Wilcoxon test compared to mGO53). Bars represent the mean. c Representative flow cytometry histograms of Gag staining in non-infected (left) and infected (HIV-1 strain CH058 (CD4−Gag+); right) cells after 24 h of culture without antibody (No ab), with an isotype control (mGO53) or with a bNAb (10–1074). The dotted lines indicate the median fluorescence intensity (MFI) of the “No ab” condition. d Cell-associated Gag levels of CD4 T cells infected with different strains of HIV-1 and cultivated for 24 h with an isotype control or bNAbs. The MFI of staining was measured by flow cytometry and normalized to the “no antibody” condition. Each dot represents a donor of CD4 T cells (n = 6). *p = 0.0313 (two-tailed Wilcoxon test compared to mGO53). Bars represent the mean. e Fold-change in the p24 levels in the supernatants (top) and the cell-associated Gag levels (middle) were measured in CD4 T cells infected with three strains of HIV-1 (AD8, CH058, and vKB18) and cultivated with non-neutralizing antibodies (nnAbs) or bNAbs targeting various epitopes of the envelope (CD4 binding site [CD4bs], V3 loop, V1/V2 loop, Membrane Proximal External Region [MPER] and gp120/gp41 interface). Levels of binding to infected cells for the same antibodies are also depicted (bottom). Data represent the mean of 6 donors of CD4 T cells. f Correlation between the fold-change in cell-associated Gag, the fold-change in supernatant p24 levels and antibody binding to infected cells. Each dot represents a different antibody (n = 18). Mean values of six donors of CD4 T cells are depicted. Data from cells infected with three different viral strains are represented with different colors. A two-tailed Spearman correlation test was performed, and the correlation r and p-value are indicated. Antibodies were tested at a concentration of 100 nM, corresponding to 15 μg/mL. Source data are provided as a Source Data file.

