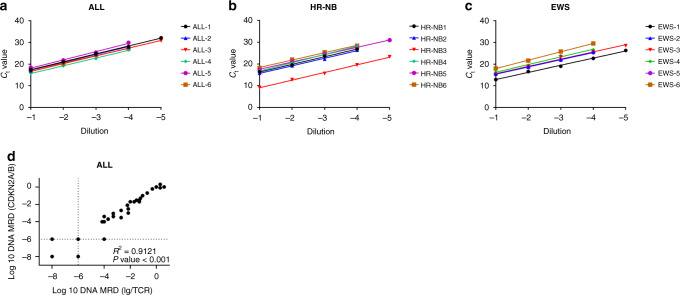
Fig. 1. Analysis of WGS-MRD markers in ALL, HR-NB and EWS.
Linear regression standard dilution curves for WGS-MRD markers detected by quantitative RT-PCR in a ALL, b HR-NB and c EWS. Slope and R2 values are shown in Table 2. Ct values represent the mean of triplicate experiments and are plotted against sample serial dilution based on the lowest quantitative range of 10−4 (0.01%) or 10−5 (0.001). d Pearson’s correlation analysis of patient-specific CDKN2A/B MRD assays to previously developed Ig/TCR assays using qPCR in clinical samples from six ALL patients. Each data point represents an individual clinical sample. Dotted lines indicate thresholds for positive, but non-quantitative (PNQ) MRD as assigned according to EuroMRD guidelines.

