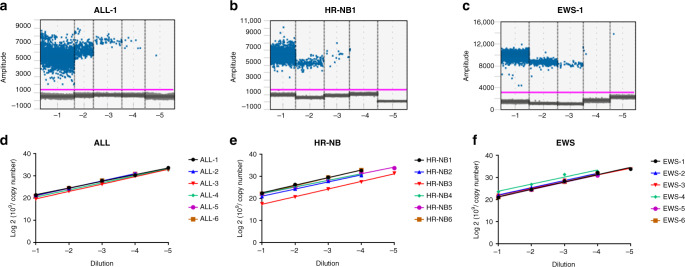
Fig. 2.
Representative 1D plots obtained by ddPCR analysis showing fluorescence produced by patient-specific probes and copy numbers in 10-fold serial dilutions of a ALL, b HR-NB and c EWS patient DNA. The FAM fluorescent signal (y-axis) of each droplet is plotted against the droplet cumulative count (x-axis). Each dot above the threshold line shows a positive droplet for the patient-specific DNA breakpoint target. d–f Linear regression standard curves obtained by log 2 transformation of ddPCR copy numbers in serial dilutions of ALL, HR-NB and EWS DNA.

