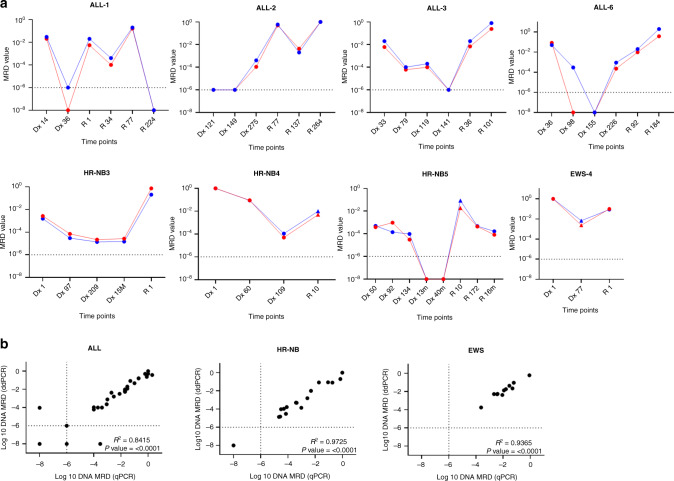
Fig. 3.
a WGS-MRD analysis of disease course by qPCR (red) and ddPCR (blue) in serially collected patient samples of ALL, HR-NB and EWS. Each panel represents an individual patient and MRD level detected at specific time points in clinical specimens of bone marrow (dot) or peripheral blood (triangle). ‘Dx’ and ‘R’ represents days/months (m) post-diagnosis and relapse, respectively. b Pearson’s correlation plots of MRD detected by qPCR and ddPCR in ALL, HR-NB and EWS. Each data point represents an individual clinical sample. Dotted lines indicate positive but non-quantitative (PNQ) MRD as assigned according to EuroMRD guidelines.

